Immigrants from Austria vs Latvian Wage/Income Gap
COMPARE
Immigrants from Austria
Latvian
Wage/Income Gap
Wage/Income Gap Comparison
Immigrants from Austria
Latvians
28.1%
WAGE/INCOME GAP
0.4/ 100
METRIC RATING
286th/ 347
METRIC RANK
27.9%
WAGE/INCOME GAP
0.7/ 100
METRIC RATING
277th/ 347
METRIC RANK
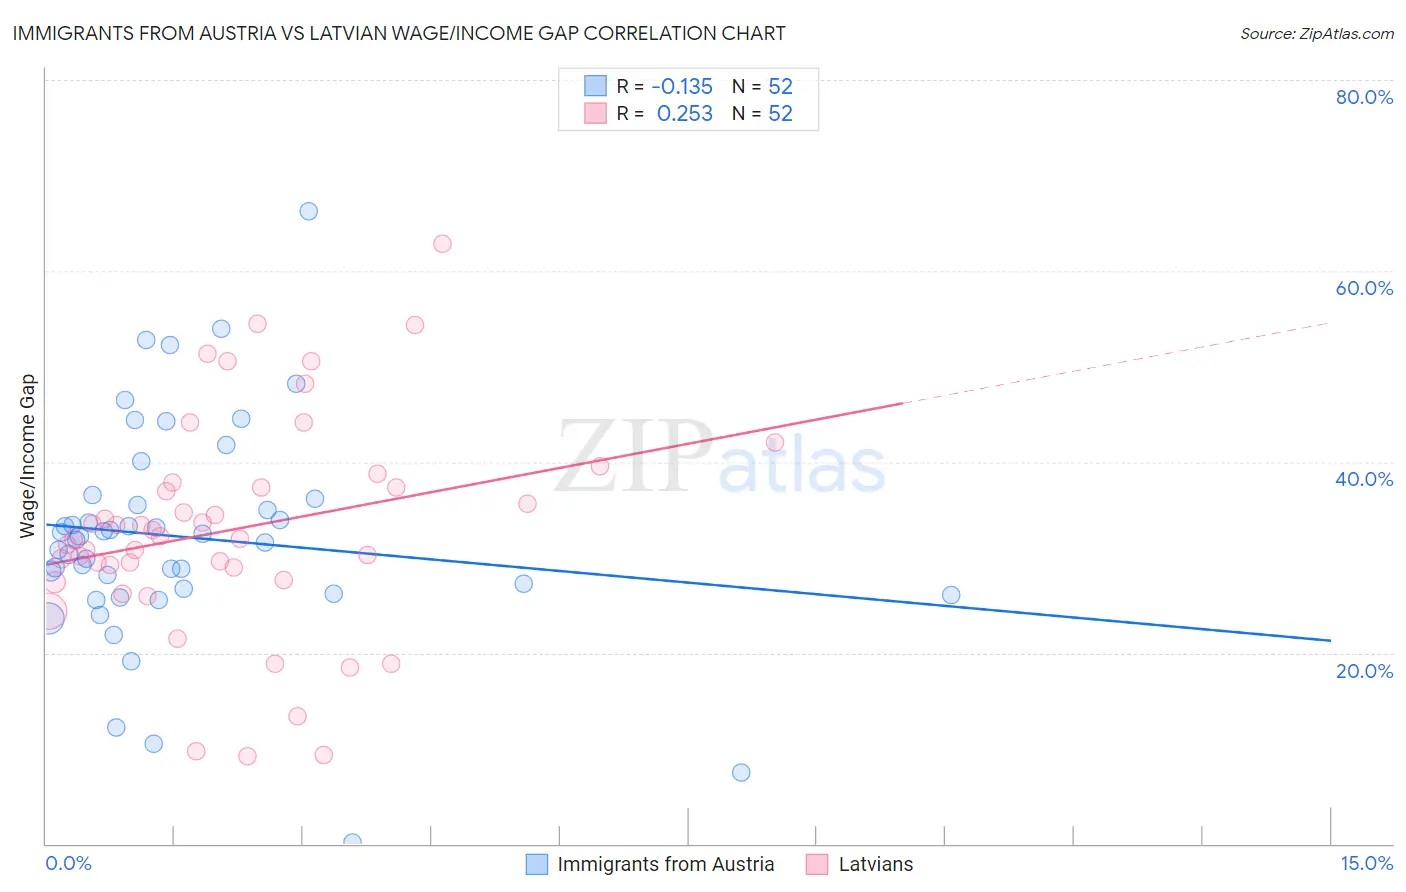
Immigrants from Austria vs Latvian Wage/Income Gap Correlation Chart
The statistical analysis conducted on geographies consisting of 167,902,173 people shows a poor negative correlation between the proportion of Immigrants from Austria and wage/income gap percentage in the United States with a correlation coefficient (R) of -0.135 and weighted average of 28.1%. Similarly, the statistical analysis conducted on geographies consisting of 220,666,647 people shows a weak positive correlation between the proportion of Latvians and wage/income gap percentage in the United States with a correlation coefficient (R) of 0.253 and weighted average of 27.9%, a difference of 0.89%.
Wage/Income Gap Correlation Summary
| Measurement | Immigrants from Austria | Latvian |
| Minimum | 0.18% | 9.2% |
| Maximum | 66.3% | 62.8% |
| Range | 66.1% | 53.6% |
| Mean | 32.1% | 32.9% |
| Median | 32.1% | 32.1% |
| Interquartile 25% (IQ1) | 26.4% | 28.3% |
| Interquartile 75% (IQ3) | 35.9% | 37.6% |
| Interquartile Range (IQR) | 9.4% | 9.3% |
| Standard Deviation (Sample) | 11.6% | 11.4% |
| Standard Deviation (Population) | 11.5% | 11.3% |
Demographics Similar to Immigrants from Austria and Latvians by Wage/Income Gap
In terms of wage/income gap, the demographic groups most similar to Immigrants from Austria are Italian (28.1%, a difference of 0.030%), Okinawan (28.1%, a difference of 0.040%), Choctaw (28.1%, a difference of 0.070%), Canadian (28.1%, a difference of 0.11%), and Immigrants from Sweden (28.1%, a difference of 0.16%). Similarly, the demographic groups most similar to Latvians are Lebanese (27.9%, a difference of 0.0%), Immigrants from Japan (27.9%, a difference of 0.030%), Immigrants from England (27.9%, a difference of 0.080%), American (27.8%, a difference of 0.11%), and Bulgarian (27.8%, a difference of 0.15%).
| Demographics | Rating | Rank | Wage/Income Gap |
| Ute | 0.8 /100 | #271 | Tragic 27.8% |
| Immigrants | Korea | 0.8 /100 | #272 | Tragic 27.8% |
| Bulgarians | 0.7 /100 | #273 | Tragic 27.8% |
| Americans | 0.7 /100 | #274 | Tragic 27.8% |
| Immigrants | Japan | 0.7 /100 | #275 | Tragic 27.9% |
| Lebanese | 0.7 /100 | #276 | Tragic 27.9% |
| Latvians | 0.7 /100 | #277 | Tragic 27.9% |
| Immigrants | England | 0.6 /100 | #278 | Tragic 27.9% |
| Romanians | 0.5 /100 | #279 | Tragic 28.0% |
| Russians | 0.5 /100 | #280 | Tragic 28.0% |
| Burmese | 0.5 /100 | #281 | Tragic 28.0% |
| South Africans | 0.5 /100 | #282 | Tragic 28.0% |
| French Canadians | 0.4 /100 | #283 | Tragic 28.1% |
| Immigrants | Sweden | 0.4 /100 | #284 | Tragic 28.1% |
| Italians | 0.4 /100 | #285 | Tragic 28.1% |
| Immigrants | Austria | 0.4 /100 | #286 | Tragic 28.1% |
| Okinawans | 0.4 /100 | #287 | Tragic 28.1% |
| Choctaw | 0.4 /100 | #288 | Tragic 28.1% |
| Canadians | 0.3 /100 | #289 | Tragic 28.1% |
| Australians | 0.3 /100 | #290 | Tragic 28.2% |
| Czechoslovakians | 0.3 /100 | #291 | Tragic 28.2% |