Immigrants from Burma/Myanmar vs Ute Householder Income Under 25 years
COMPARE
Immigrants from Burma/Myanmar
Ute
Householder Income Under 25 years
Householder Income Under 25 years Comparison
Immigrants from Burma/Myanmar
Ute
$48,749
HOUSEHOLDER INCOME UNDER 25 YEARS
0.0/ 100
METRIC RATING
291st/ 347
METRIC RANK
$49,997
HOUSEHOLDER INCOME UNDER 25 YEARS
0.5/ 100
METRIC RATING
269th/ 347
METRIC RANK
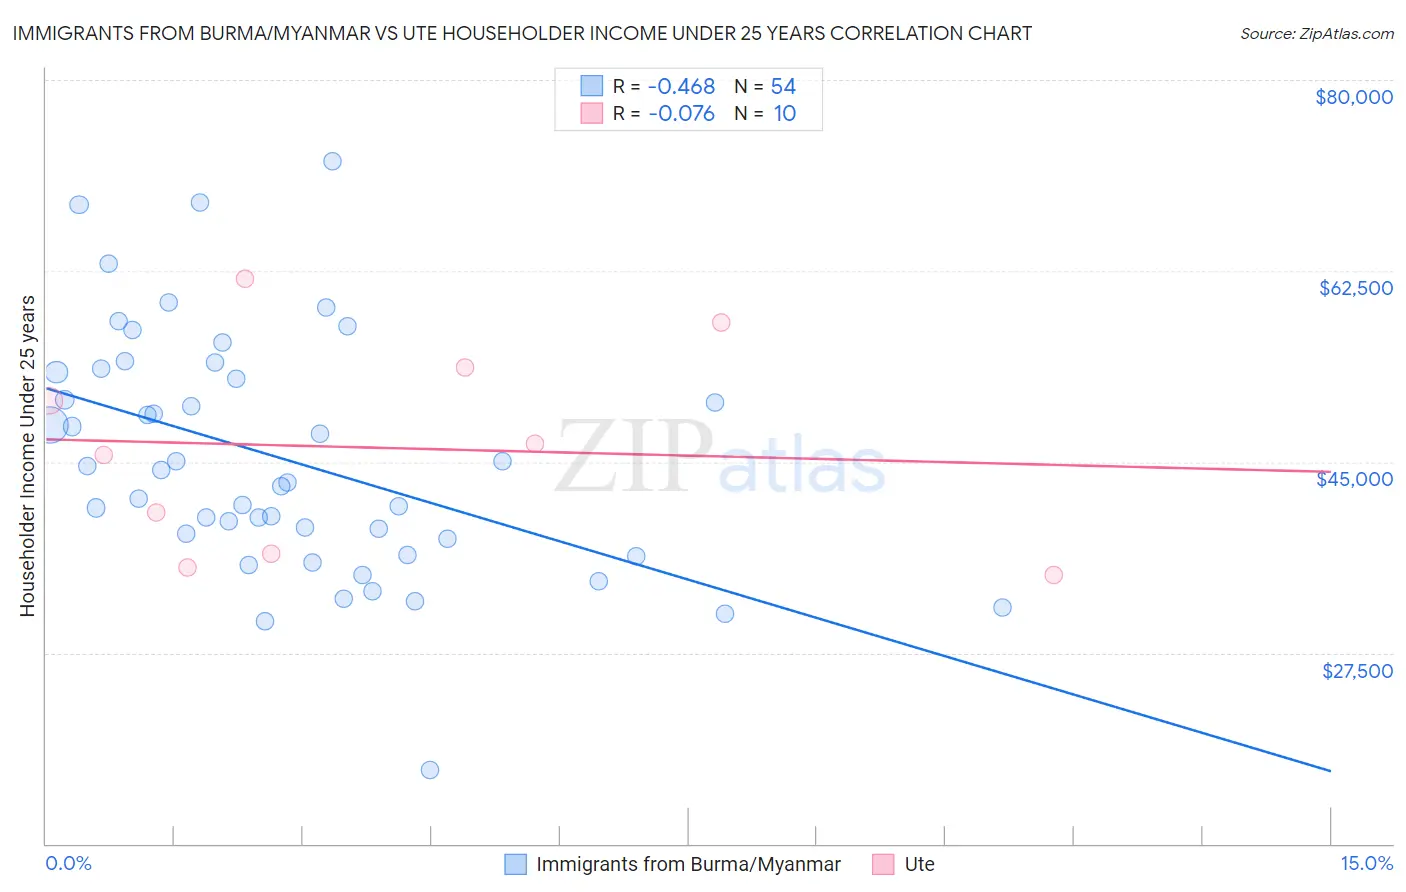
Immigrants from Burma/Myanmar vs Ute Householder Income Under 25 years Correlation Chart
The statistical analysis conducted on geographies consisting of 158,147,131 people shows a moderate negative correlation between the proportion of Immigrants from Burma/Myanmar and household income with householder under the age of 25 in the United States with a correlation coefficient (R) of -0.468 and weighted average of $48,749. Similarly, the statistical analysis conducted on geographies consisting of 53,586,757 people shows a slight negative correlation between the proportion of Ute and household income with householder under the age of 25 in the United States with a correlation coefficient (R) of -0.076 and weighted average of $49,997, a difference of 2.6%.
Householder Income Under 25 years Correlation Summary
| Measurement | Immigrants from Burma/Myanmar | Ute |
| Minimum | $16,806 | $34,583 |
| Maximum | $72,545 | $61,768 |
| Range | $55,739 | $27,185 |
| Mean | $45,291 | $46,291 |
| Median | $43,645 | $46,136 |
| Interquartile 25% (IQ1) | $37,955 | $36,563 |
| Interquartile 75% (IQ3) | $53,234 | $53,646 |
| Interquartile Range (IQR) | $15,279 | $17,083 |
| Standard Deviation (Sample) | $11,040 | $9,620 |
| Standard Deviation (Population) | $10,937 | $9,126 |
Similar Demographics by Householder Income Under 25 years
Demographics Similar to Immigrants from Burma/Myanmar by Householder Income Under 25 years
In terms of householder income under 25 years, the demographic groups most similar to Immigrants from Burma/Myanmar are Shoshone ($48,720, a difference of 0.060%), Subsaharan African ($48,691, a difference of 0.12%), Somali ($48,657, a difference of 0.19%), Central American Indian ($48,643, a difference of 0.22%), and American ($48,860, a difference of 0.23%).
| Demographics | Rating | Rank | Householder Income Under 25 years |
| Carpatho Rusyns | 0.1 /100 | #284 | Tragic $49,113 |
| Scotch-Irish | 0.0 /100 | #285 | Tragic $49,039 |
| French American Indians | 0.0 /100 | #286 | Tragic $48,977 |
| Senegalese | 0.0 /100 | #287 | Tragic $48,953 |
| Liberians | 0.0 /100 | #288 | Tragic $48,917 |
| Hondurans | 0.0 /100 | #289 | Tragic $48,885 |
| Americans | 0.0 /100 | #290 | Tragic $48,860 |
| Immigrants | Burma/Myanmar | 0.0 /100 | #291 | Tragic $48,749 |
| Shoshone | 0.0 /100 | #292 | Tragic $48,720 |
| Sub-Saharan Africans | 0.0 /100 | #293 | Tragic $48,691 |
| Somalis | 0.0 /100 | #294 | Tragic $48,657 |
| Central American Indians | 0.0 /100 | #295 | Tragic $48,643 |
| Blackfeet | 0.0 /100 | #296 | Tragic $48,603 |
| Cree | 0.0 /100 | #297 | Tragic $48,514 |
| Yaqui | 0.0 /100 | #298 | Tragic $48,300 |
Demographics Similar to Ute by Householder Income Under 25 years
In terms of householder income under 25 years, the demographic groups most similar to Ute are Mexican ($49,989, a difference of 0.010%), Venezuelan ($50,011, a difference of 0.030%), Immigrants from Laos ($50,041, a difference of 0.090%), Immigrants from Venezuela ($50,109, a difference of 0.22%), and Belgian ($50,113, a difference of 0.23%).
| Demographics | Rating | Rank | Householder Income Under 25 years |
| Haitians | 0.8 /100 | #262 | Tragic $50,231 |
| Immigrants | Dominican Republic | 0.8 /100 | #263 | Tragic $50,204 |
| Fijians | 0.6 /100 | #264 | Tragic $50,132 |
| Belgians | 0.6 /100 | #265 | Tragic $50,113 |
| Immigrants | Venezuela | 0.6 /100 | #266 | Tragic $50,109 |
| Immigrants | Laos | 0.5 /100 | #267 | Tragic $50,041 |
| Venezuelans | 0.5 /100 | #268 | Tragic $50,011 |
| Ute | 0.5 /100 | #269 | Tragic $49,997 |
| Mexicans | 0.5 /100 | #270 | Tragic $49,989 |
| Taiwanese | 0.3 /100 | #271 | Tragic $49,804 |
| Colville | 0.3 /100 | #272 | Tragic $49,774 |
| Slovaks | 0.3 /100 | #273 | Tragic $49,753 |
| Immigrants | Senegal | 0.3 /100 | #274 | Tragic $49,742 |
| Immigrants | Kenya | 0.2 /100 | #275 | Tragic $49,633 |
| Dominicans | 0.2 /100 | #276 | Tragic $49,633 |