Immigrants from Burma/Myanmar vs Basque Householder Income Under 25 years
COMPARE
Immigrants from Burma/Myanmar
Basque
Householder Income Under 25 years
Householder Income Under 25 years Comparison
Immigrants from Burma/Myanmar
Basques
$48,749
HOUSEHOLDER INCOME UNDER 25 YEARS
0.0/ 100
METRIC RATING
291st/ 347
METRIC RANK
$51,818
HOUSEHOLDER INCOME UNDER 25 YEARS
28.7/ 100
METRIC RATING
179th/ 347
METRIC RANK
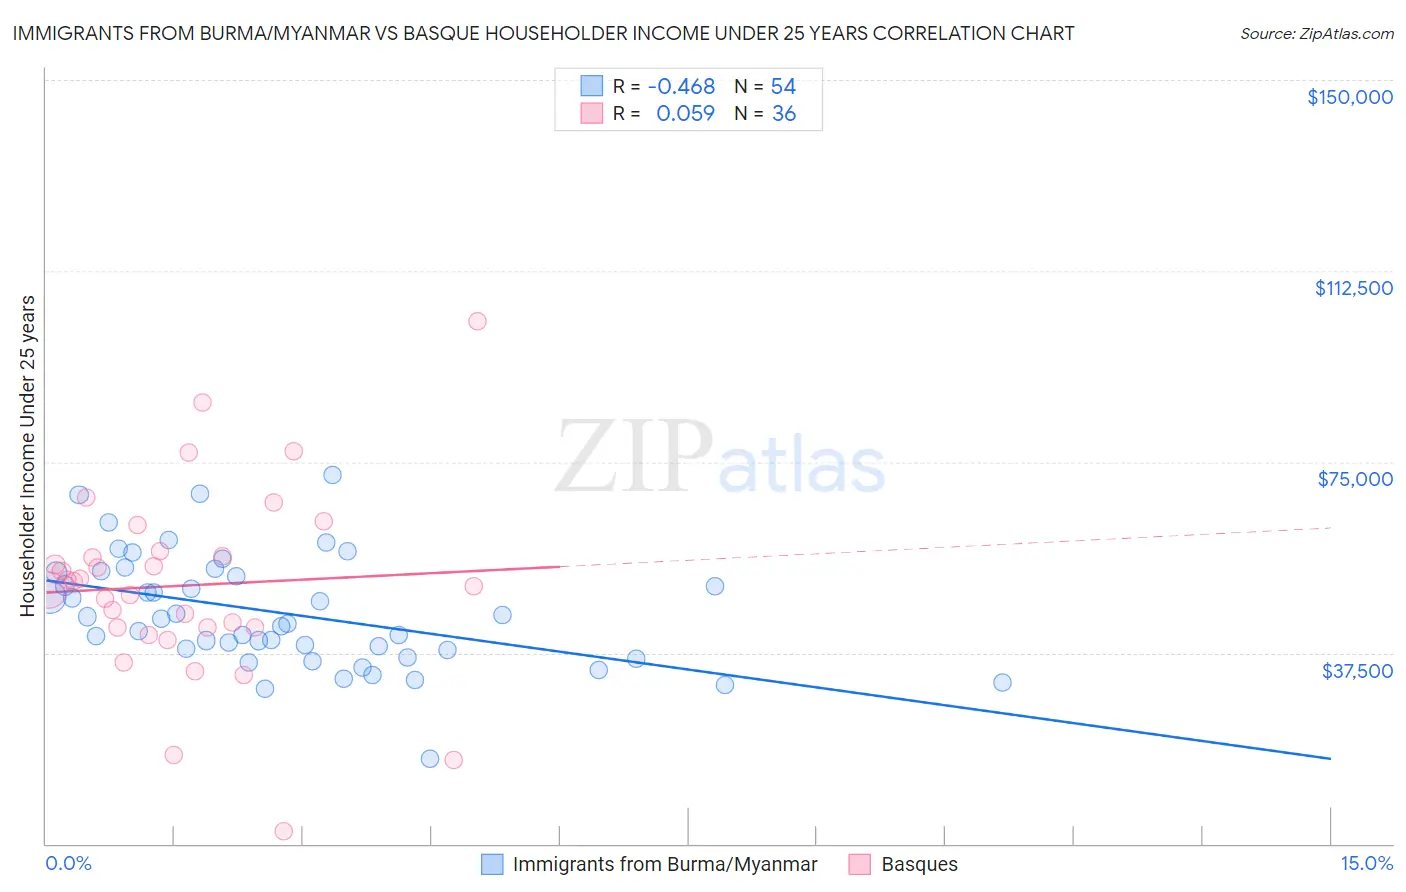
Immigrants from Burma/Myanmar vs Basque Householder Income Under 25 years Correlation Chart
The statistical analysis conducted on geographies consisting of 158,147,131 people shows a moderate negative correlation between the proportion of Immigrants from Burma/Myanmar and household income with householder under the age of 25 in the United States with a correlation coefficient (R) of -0.468 and weighted average of $48,749. Similarly, the statistical analysis conducted on geographies consisting of 150,470,648 people shows a slight positive correlation between the proportion of Basques and household income with householder under the age of 25 in the United States with a correlation coefficient (R) of 0.059 and weighted average of $51,818, a difference of 6.3%.
Householder Income Under 25 years Correlation Summary
| Measurement | Immigrants from Burma/Myanmar | Basque |
| Minimum | $16,806 | $2,499 |
| Maximum | $72,545 | $102,571 |
| Range | $55,739 | $100,072 |
| Mean | $45,291 | $50,731 |
| Median | $43,645 | $51,007 |
| Interquartile 25% (IQ1) | $37,955 | $42,540 |
| Interquartile 75% (IQ3) | $53,234 | $57,010 |
| Interquartile Range (IQR) | $15,279 | $14,470 |
| Standard Deviation (Sample) | $11,040 | $18,783 |
| Standard Deviation (Population) | $10,937 | $18,521 |
Similar Demographics by Householder Income Under 25 years
Demographics Similar to Immigrants from Burma/Myanmar by Householder Income Under 25 years
In terms of householder income under 25 years, the demographic groups most similar to Immigrants from Burma/Myanmar are Shoshone ($48,720, a difference of 0.060%), Subsaharan African ($48,691, a difference of 0.12%), Somali ($48,657, a difference of 0.19%), Central American Indian ($48,643, a difference of 0.22%), and American ($48,860, a difference of 0.23%).
| Demographics | Rating | Rank | Householder Income Under 25 years |
| Carpatho Rusyns | 0.1 /100 | #284 | Tragic $49,113 |
| Scotch-Irish | 0.0 /100 | #285 | Tragic $49,039 |
| French American Indians | 0.0 /100 | #286 | Tragic $48,977 |
| Senegalese | 0.0 /100 | #287 | Tragic $48,953 |
| Liberians | 0.0 /100 | #288 | Tragic $48,917 |
| Hondurans | 0.0 /100 | #289 | Tragic $48,885 |
| Americans | 0.0 /100 | #290 | Tragic $48,860 |
| Immigrants | Burma/Myanmar | 0.0 /100 | #291 | Tragic $48,749 |
| Shoshone | 0.0 /100 | #292 | Tragic $48,720 |
| Sub-Saharan Africans | 0.0 /100 | #293 | Tragic $48,691 |
| Somalis | 0.0 /100 | #294 | Tragic $48,657 |
| Central American Indians | 0.0 /100 | #295 | Tragic $48,643 |
| Blackfeet | 0.0 /100 | #296 | Tragic $48,603 |
| Cree | 0.0 /100 | #297 | Tragic $48,514 |
| Yaqui | 0.0 /100 | #298 | Tragic $48,300 |
Demographics Similar to Basques by Householder Income Under 25 years
In terms of householder income under 25 years, the demographic groups most similar to Basques are Immigrants from England ($51,817, a difference of 0.0%), Finnish ($51,827, a difference of 0.020%), European ($51,796, a difference of 0.040%), Jordanian ($51,796, a difference of 0.040%), and British West Indian ($51,844, a difference of 0.050%).
| Demographics | Rating | Rank | Householder Income Under 25 years |
| Cypriots | 51.2 /100 | #172 | Average $52,209 |
| Barbadians | 50.8 /100 | #173 | Average $52,202 |
| Immigrants | Western Asia | 50.0 /100 | #174 | Average $52,190 |
| Immigrants | Zimbabwe | 33.8 /100 | #175 | Fair $51,914 |
| Austrians | 32.9 /100 | #176 | Fair $51,898 |
| British West Indians | 30.0 /100 | #177 | Fair $51,844 |
| Finns | 29.2 /100 | #178 | Fair $51,827 |
| Basques | 28.7 /100 | #179 | Fair $51,818 |
| Immigrants | England | 28.7 /100 | #180 | Fair $51,817 |
| Europeans | 27.6 /100 | #181 | Fair $51,796 |
| Jordanians | 27.6 /100 | #182 | Fair $51,796 |
| Mexican American Indians | 27.0 /100 | #183 | Fair $51,783 |
| Paiute | 25.1 /100 | #184 | Fair $51,743 |
| Immigrants | Latvia | 24.8 /100 | #185 | Fair $51,737 |
| Alaskan Athabascans | 23.8 /100 | #186 | Fair $51,713 |