Immigrants from Burma/Myanmar vs Belizean Householder Income Under 25 years
COMPARE
Immigrants from Burma/Myanmar
Belizean
Householder Income Under 25 years
Householder Income Under 25 years Comparison
Immigrants from Burma/Myanmar
Belizeans
$48,749
HOUSEHOLDER INCOME UNDER 25 YEARS
0.0/ 100
METRIC RATING
291st/ 347
METRIC RANK
$51,094
HOUSEHOLDER INCOME UNDER 25 YEARS
6.4/ 100
METRIC RATING
224th/ 347
METRIC RANK
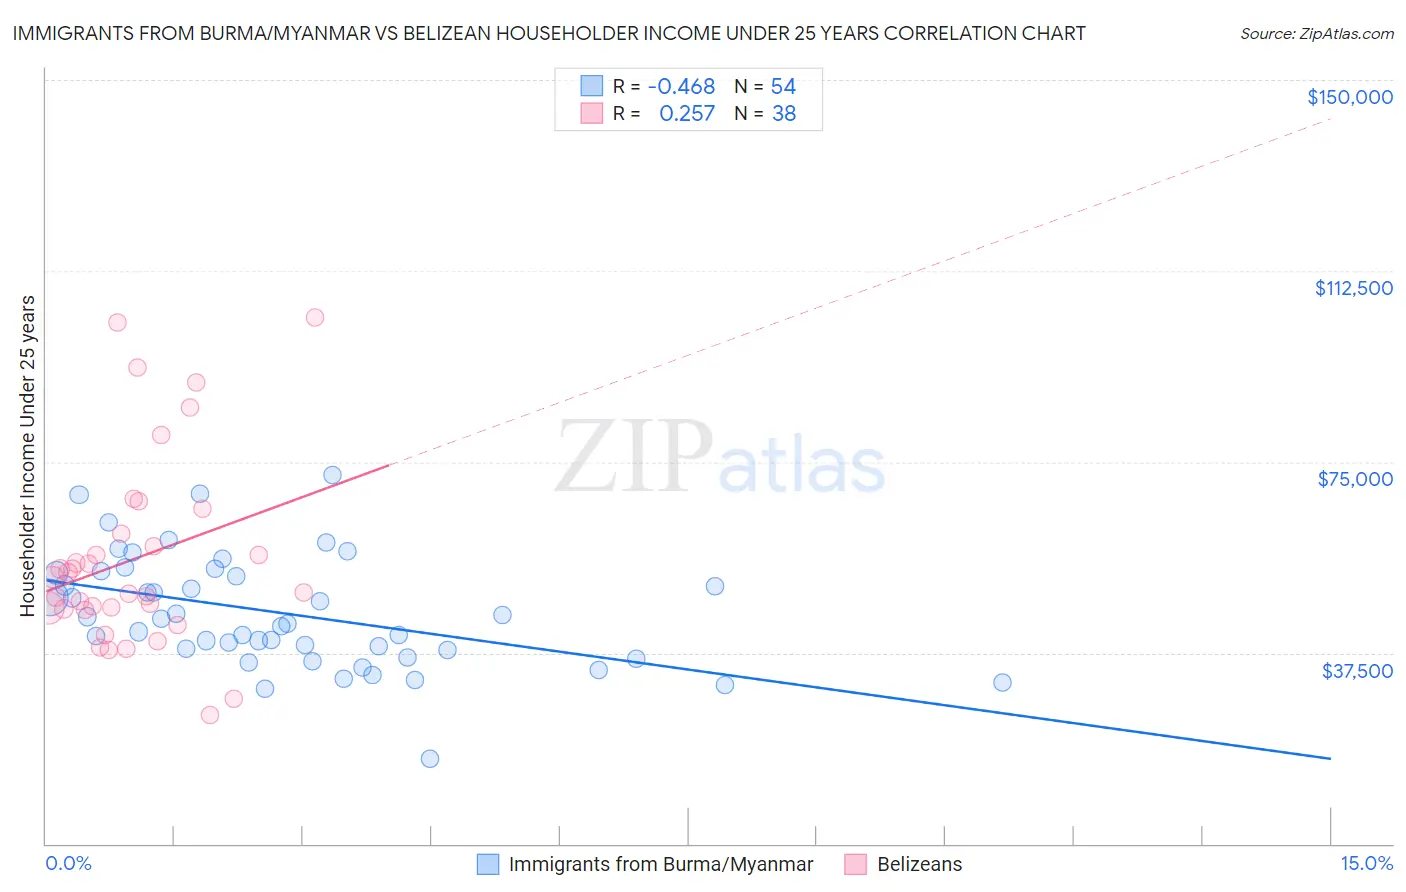
Immigrants from Burma/Myanmar vs Belizean Householder Income Under 25 years Correlation Chart
The statistical analysis conducted on geographies consisting of 158,147,131 people shows a moderate negative correlation between the proportion of Immigrants from Burma/Myanmar and household income with householder under the age of 25 in the United States with a correlation coefficient (R) of -0.468 and weighted average of $48,749. Similarly, the statistical analysis conducted on geographies consisting of 132,883,097 people shows a weak positive correlation between the proportion of Belizeans and household income with householder under the age of 25 in the United States with a correlation coefficient (R) of 0.257 and weighted average of $51,094, a difference of 4.8%.
Householder Income Under 25 years Correlation Summary
| Measurement | Immigrants from Burma/Myanmar | Belizean |
| Minimum | $16,806 | $25,260 |
| Maximum | $72,545 | $103,333 |
| Range | $55,739 | $78,073 |
| Mean | $45,291 | $55,975 |
| Median | $43,645 | $50,853 |
| Interquartile 25% (IQ1) | $37,955 | $46,192 |
| Interquartile 75% (IQ3) | $53,234 | $60,909 |
| Interquartile Range (IQR) | $15,279 | $14,716 |
| Standard Deviation (Sample) | $11,040 | $18,766 |
| Standard Deviation (Population) | $10,937 | $18,517 |
Similar Demographics by Householder Income Under 25 years
Demographics Similar to Immigrants from Burma/Myanmar by Householder Income Under 25 years
In terms of householder income under 25 years, the demographic groups most similar to Immigrants from Burma/Myanmar are Shoshone ($48,720, a difference of 0.060%), Subsaharan African ($48,691, a difference of 0.12%), Somali ($48,657, a difference of 0.19%), Central American Indian ($48,643, a difference of 0.22%), and American ($48,860, a difference of 0.23%).
| Demographics | Rating | Rank | Householder Income Under 25 years |
| Carpatho Rusyns | 0.1 /100 | #284 | Tragic $49,113 |
| Scotch-Irish | 0.0 /100 | #285 | Tragic $49,039 |
| French American Indians | 0.0 /100 | #286 | Tragic $48,977 |
| Senegalese | 0.0 /100 | #287 | Tragic $48,953 |
| Liberians | 0.0 /100 | #288 | Tragic $48,917 |
| Hondurans | 0.0 /100 | #289 | Tragic $48,885 |
| Americans | 0.0 /100 | #290 | Tragic $48,860 |
| Immigrants | Burma/Myanmar | 0.0 /100 | #291 | Tragic $48,749 |
| Shoshone | 0.0 /100 | #292 | Tragic $48,720 |
| Sub-Saharan Africans | 0.0 /100 | #293 | Tragic $48,691 |
| Somalis | 0.0 /100 | #294 | Tragic $48,657 |
| Central American Indians | 0.0 /100 | #295 | Tragic $48,643 |
| Blackfeet | 0.0 /100 | #296 | Tragic $48,603 |
| Cree | 0.0 /100 | #297 | Tragic $48,514 |
| Yaqui | 0.0 /100 | #298 | Tragic $48,300 |
Demographics Similar to Belizeans by Householder Income Under 25 years
In terms of householder income under 25 years, the demographic groups most similar to Belizeans are Serbian ($51,106, a difference of 0.020%), Spaniard ($51,117, a difference of 0.050%), Immigrants from Jamaica ($51,038, a difference of 0.11%), Immigrants from Eastern Africa ($51,158, a difference of 0.13%), and Yugoslavian ($51,028, a difference of 0.13%).
| Demographics | Rating | Rank | Householder Income Under 25 years |
| Czechoslovakians | 8.6 /100 | #217 | Tragic $51,224 |
| Immigrants | Belize | 8.6 /100 | #218 | Tragic $51,223 |
| Arabs | 8.5 /100 | #219 | Tragic $51,219 |
| Immigrants | Germany | 8.0 /100 | #220 | Tragic $51,190 |
| Immigrants | Eastern Africa | 7.4 /100 | #221 | Tragic $51,158 |
| Spaniards | 6.8 /100 | #222 | Tragic $51,117 |
| Serbians | 6.6 /100 | #223 | Tragic $51,106 |
| Belizeans | 6.4 /100 | #224 | Tragic $51,094 |
| Immigrants | Jamaica | 5.6 /100 | #225 | Tragic $51,038 |
| Yugoslavians | 5.5 /100 | #226 | Tragic $51,028 |
| Immigrants | Central America | 5.4 /100 | #227 | Tragic $51,022 |
| Immigrants | Norway | 5.0 /100 | #228 | Tragic $50,984 |
| Yuman | 4.4 /100 | #229 | Tragic $50,933 |
| Jamaicans | 4.4 /100 | #230 | Tragic $50,929 |
| Ugandans | 4.3 /100 | #231 | Tragic $50,923 |