Immigrants from Burma/Myanmar vs Maltese Householder Income Under 25 years
COMPARE
Immigrants from Burma/Myanmar
Maltese
Householder Income Under 25 years
Householder Income Under 25 years Comparison
Immigrants from Burma/Myanmar
Maltese
$48,749
HOUSEHOLDER INCOME UNDER 25 YEARS
0.0/ 100
METRIC RATING
291st/ 347
METRIC RANK
$53,735
HOUSEHOLDER INCOME UNDER 25 YEARS
97.8/ 100
METRIC RATING
108th/ 347
METRIC RANK
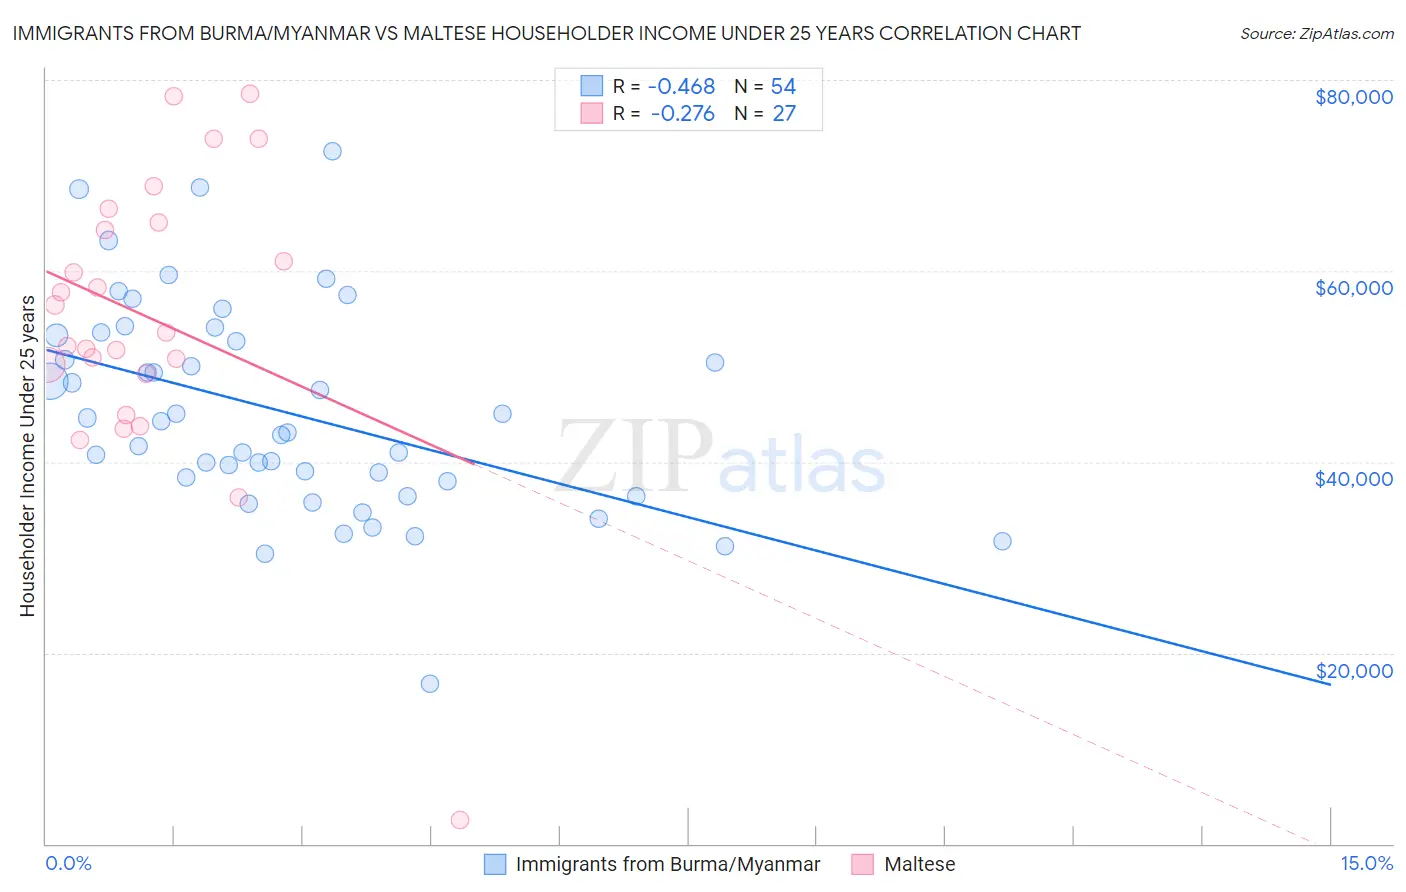
Immigrants from Burma/Myanmar vs Maltese Householder Income Under 25 years Correlation Chart
The statistical analysis conducted on geographies consisting of 158,147,131 people shows a moderate negative correlation between the proportion of Immigrants from Burma/Myanmar and household income with householder under the age of 25 in the United States with a correlation coefficient (R) of -0.468 and weighted average of $48,749. Similarly, the statistical analysis conducted on geographies consisting of 112,948,786 people shows a weak negative correlation between the proportion of Maltese and household income with householder under the age of 25 in the United States with a correlation coefficient (R) of -0.276 and weighted average of $53,735, a difference of 10.2%.
Householder Income Under 25 years Correlation Summary
| Measurement | Immigrants from Burma/Myanmar | Maltese |
| Minimum | $16,806 | $2,499 |
| Maximum | $72,545 | $78,500 |
| Range | $55,739 | $76,001 |
| Mean | $45,291 | $55,048 |
| Median | $43,645 | $53,500 |
| Interquartile 25% (IQ1) | $37,955 | $49,238 |
| Interquartile 75% (IQ3) | $53,234 | $65,046 |
| Interquartile Range (IQR) | $15,279 | $15,807 |
| Standard Deviation (Sample) | $11,040 | $15,373 |
| Standard Deviation (Population) | $10,937 | $15,086 |
Similar Demographics by Householder Income Under 25 years
Demographics Similar to Immigrants from Burma/Myanmar by Householder Income Under 25 years
In terms of householder income under 25 years, the demographic groups most similar to Immigrants from Burma/Myanmar are Shoshone ($48,720, a difference of 0.060%), Subsaharan African ($48,691, a difference of 0.12%), Somali ($48,657, a difference of 0.19%), Central American Indian ($48,643, a difference of 0.22%), and American ($48,860, a difference of 0.23%).
| Demographics | Rating | Rank | Householder Income Under 25 years |
| Carpatho Rusyns | 0.1 /100 | #284 | Tragic $49,113 |
| Scotch-Irish | 0.0 /100 | #285 | Tragic $49,039 |
| French American Indians | 0.0 /100 | #286 | Tragic $48,977 |
| Senegalese | 0.0 /100 | #287 | Tragic $48,953 |
| Liberians | 0.0 /100 | #288 | Tragic $48,917 |
| Hondurans | 0.0 /100 | #289 | Tragic $48,885 |
| Americans | 0.0 /100 | #290 | Tragic $48,860 |
| Immigrants | Burma/Myanmar | 0.0 /100 | #291 | Tragic $48,749 |
| Shoshone | 0.0 /100 | #292 | Tragic $48,720 |
| Sub-Saharan Africans | 0.0 /100 | #293 | Tragic $48,691 |
| Somalis | 0.0 /100 | #294 | Tragic $48,657 |
| Central American Indians | 0.0 /100 | #295 | Tragic $48,643 |
| Blackfeet | 0.0 /100 | #296 | Tragic $48,603 |
| Cree | 0.0 /100 | #297 | Tragic $48,514 |
| Yaqui | 0.0 /100 | #298 | Tragic $48,300 |
Demographics Similar to Maltese by Householder Income Under 25 years
In terms of householder income under 25 years, the demographic groups most similar to Maltese are Australian ($53,739, a difference of 0.010%), Immigrants from Ecuador ($53,722, a difference of 0.020%), Greek ($53,715, a difference of 0.040%), Immigrants from Colombia ($53,714, a difference of 0.040%), and Immigrants from Oceania ($53,680, a difference of 0.10%).
| Demographics | Rating | Rank | Householder Income Under 25 years |
| South Americans | 98.6 /100 | #101 | Exceptional $53,939 |
| Ecuadorians | 98.5 /100 | #102 | Exceptional $53,911 |
| Ukrainians | 98.3 /100 | #103 | Exceptional $53,843 |
| Ethiopians | 98.2 /100 | #104 | Exceptional $53,818 |
| Immigrants | France | 98.1 /100 | #105 | Exceptional $53,805 |
| Albanians | 98.1 /100 | #106 | Exceptional $53,794 |
| Australians | 97.8 /100 | #107 | Exceptional $53,739 |
| Maltese | 97.8 /100 | #108 | Exceptional $53,735 |
| Immigrants | Ecuador | 97.7 /100 | #109 | Exceptional $53,722 |
| Greeks | 97.7 /100 | #110 | Exceptional $53,715 |
| Immigrants | Colombia | 97.7 /100 | #111 | Exceptional $53,714 |
| Immigrants | Oceania | 97.5 /100 | #112 | Exceptional $53,680 |
| Romanians | 97.2 /100 | #113 | Exceptional $53,632 |
| Immigrants | Sweden | 97.1 /100 | #114 | Exceptional $53,621 |
| Immigrants | Albania | 96.9 /100 | #115 | Exceptional $53,597 |