Immigrants from Burma/Myanmar vs Menominee Householder Income Under 25 years
COMPARE
Immigrants from Burma/Myanmar
Menominee
Householder Income Under 25 years
Householder Income Under 25 years Comparison
Immigrants from Burma/Myanmar
Menominee
$48,749
HOUSEHOLDER INCOME UNDER 25 YEARS
0.0/ 100
METRIC RATING
291st/ 347
METRIC RANK
$47,907
HOUSEHOLDER INCOME UNDER 25 YEARS
0.0/ 100
METRIC RATING
304th/ 347
METRIC RANK
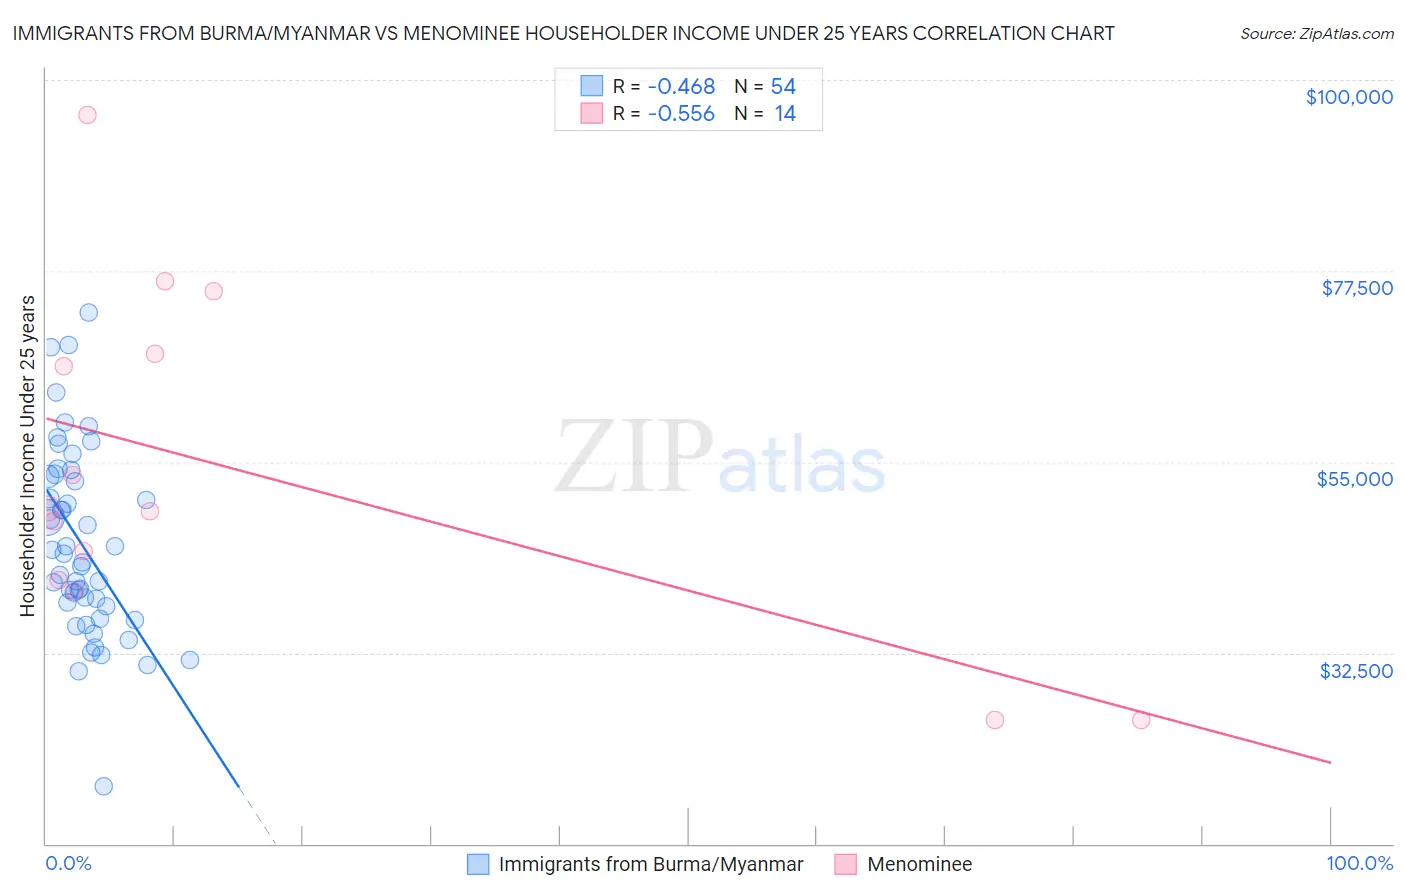
Immigrants from Burma/Myanmar vs Menominee Householder Income Under 25 years Correlation Chart
The statistical analysis conducted on geographies consisting of 158,147,131 people shows a moderate negative correlation between the proportion of Immigrants from Burma/Myanmar and household income with householder under the age of 25 in the United States with a correlation coefficient (R) of -0.468 and weighted average of $48,749. Similarly, the statistical analysis conducted on geographies consisting of 44,234,460 people shows a substantial negative correlation between the proportion of Menominee and household income with householder under the age of 25 in the United States with a correlation coefficient (R) of -0.556 and weighted average of $47,907, a difference of 1.8%.
Householder Income Under 25 years Correlation Summary
| Measurement | Immigrants from Burma/Myanmar | Menominee |
| Minimum | $16,806 | $24,615 |
| Maximum | $72,545 | $95,833 |
| Range | $55,739 | $71,218 |
| Mean | $45,291 | $53,984 |
| Median | $43,645 | $49,327 |
| Interquartile 25% (IQ1) | $37,955 | $41,044 |
| Interquartile 75% (IQ3) | $53,234 | $67,708 |
| Interquartile Range (IQR) | $15,279 | $26,664 |
| Standard Deviation (Sample) | $11,040 | $20,193 |
| Standard Deviation (Population) | $10,937 | $19,458 |
Demographics Similar to Immigrants from Burma/Myanmar and Menominee by Householder Income Under 25 years
In terms of householder income under 25 years, the demographic groups most similar to Immigrants from Burma/Myanmar are Shoshone ($48,720, a difference of 0.060%), Subsaharan African ($48,691, a difference of 0.12%), Somali ($48,657, a difference of 0.19%), Central American Indian ($48,643, a difference of 0.22%), and American ($48,860, a difference of 0.23%). Similarly, the demographic groups most similar to Menominee are Immigrants from Middle Africa ($47,916, a difference of 0.020%), Cherokee ($47,848, a difference of 0.12%), Immigrants from Liberia ($47,981, a difference of 0.15%), Native/Alaskan ($47,704, a difference of 0.43%), and Immigrants from Kuwait ($48,126, a difference of 0.46%).
| Demographics | Rating | Rank | Householder Income Under 25 years |
| Senegalese | 0.0 /100 | #287 | Tragic $48,953 |
| Liberians | 0.0 /100 | #288 | Tragic $48,917 |
| Hondurans | 0.0 /100 | #289 | Tragic $48,885 |
| Americans | 0.0 /100 | #290 | Tragic $48,860 |
| Immigrants | Burma/Myanmar | 0.0 /100 | #291 | Tragic $48,749 |
| Shoshone | 0.0 /100 | #292 | Tragic $48,720 |
| Sub-Saharan Africans | 0.0 /100 | #293 | Tragic $48,691 |
| Somalis | 0.0 /100 | #294 | Tragic $48,657 |
| Central American Indians | 0.0 /100 | #295 | Tragic $48,643 |
| Blackfeet | 0.0 /100 | #296 | Tragic $48,603 |
| Cree | 0.0 /100 | #297 | Tragic $48,514 |
| Yaqui | 0.0 /100 | #298 | Tragic $48,300 |
| Immigrants | Honduras | 0.0 /100 | #299 | Tragic $48,267 |
| Immigrants | Somalia | 0.0 /100 | #300 | Tragic $48,135 |
| Immigrants | Kuwait | 0.0 /100 | #301 | Tragic $48,126 |
| Immigrants | Liberia | 0.0 /100 | #302 | Tragic $47,981 |
| Immigrants | Middle Africa | 0.0 /100 | #303 | Tragic $47,916 |
| Menominee | 0.0 /100 | #304 | Tragic $47,907 |
| Cherokee | 0.0 /100 | #305 | Tragic $47,848 |
| Natives/Alaskans | 0.0 /100 | #306 | Tragic $47,704 |
| Bangladeshis | 0.0 /100 | #307 | Tragic $47,589 |