Immigrants from Burma/Myanmar vs Filipino Per Capita Income
COMPARE
Immigrants from Burma/Myanmar
Filipino
Per Capita Income
Per Capita Income Comparison
Immigrants from Burma/Myanmar
Filipinos
$39,827
PER CAPITA INCOME
1.3/ 100
METRIC RATING
250th/ 347
METRIC RANK
$59,066
PER CAPITA INCOME
100.0/ 100
METRIC RATING
1st/ 347
METRIC RANK
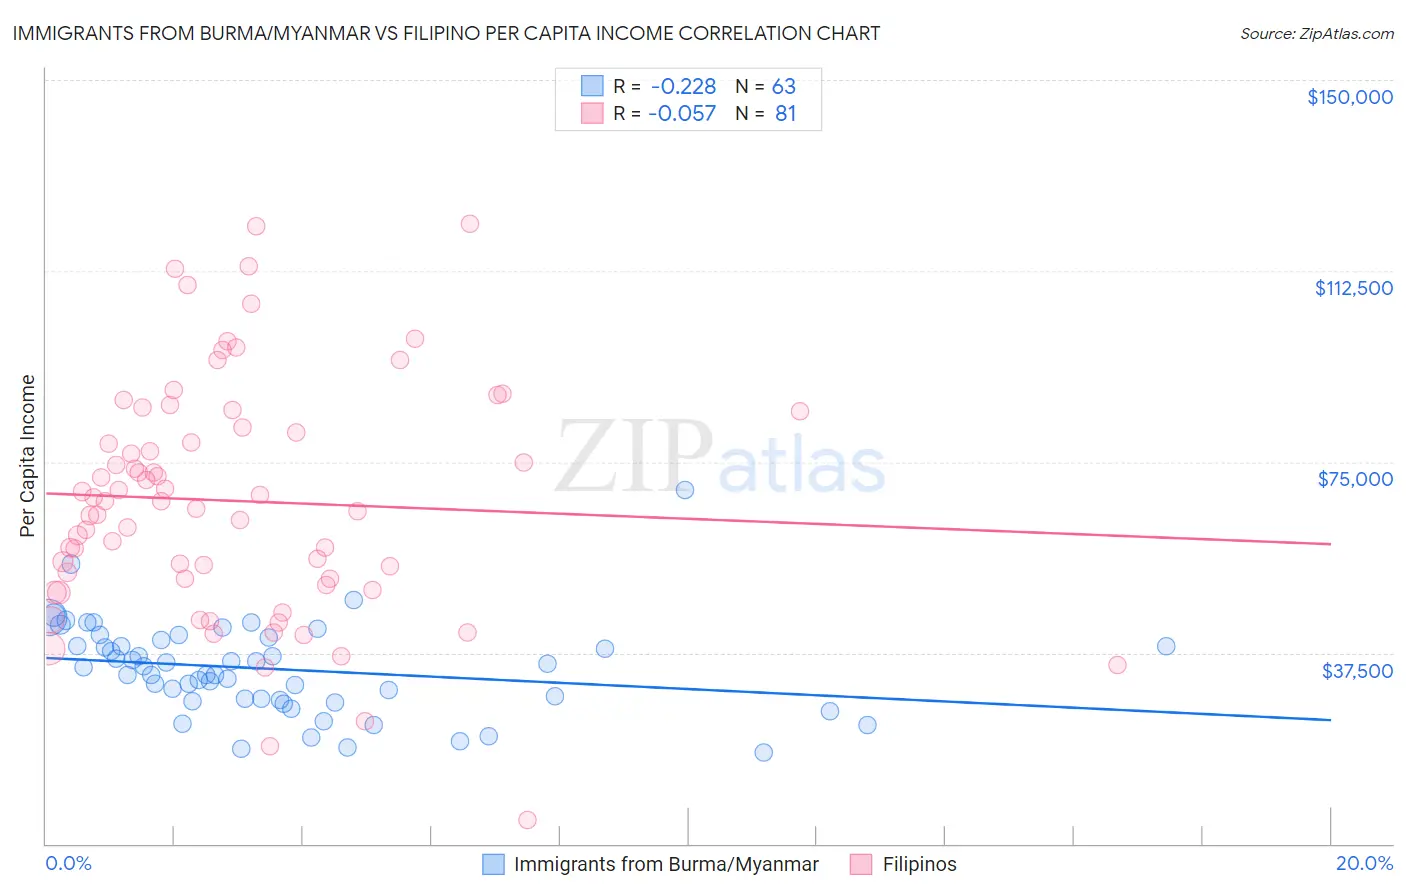
Immigrants from Burma/Myanmar vs Filipino Per Capita Income Correlation Chart
The statistical analysis conducted on geographies consisting of 172,363,704 people shows a weak negative correlation between the proportion of Immigrants from Burma/Myanmar and per capita income in the United States with a correlation coefficient (R) of -0.228 and weighted average of $39,827. Similarly, the statistical analysis conducted on geographies consisting of 254,359,894 people shows a slight negative correlation between the proportion of Filipinos and per capita income in the United States with a correlation coefficient (R) of -0.057 and weighted average of $59,066, a difference of 48.3%.
Per Capita Income Correlation Summary
| Measurement | Immigrants from Burma/Myanmar | Filipino |
| Minimum | $17,897 | $4,657 |
| Maximum | $69,358 | $121,798 |
| Range | $51,461 | $117,141 |
| Mean | $34,299 | $67,314 |
| Median | $34,636 | $67,249 |
| Interquartile 25% (IQ1) | $28,210 | $51,364 |
| Interquartile 75% (IQ3) | $40,057 | $83,421 |
| Interquartile Range (IQR) | $11,847 | $32,057 |
| Standard Deviation (Sample) | $9,103 | $23,294 |
| Standard Deviation (Population) | $9,031 | $23,149 |
Similar Demographics by Per Capita Income
Demographics Similar to Immigrants from Burma/Myanmar by Per Capita Income
In terms of per capita income, the demographic groups most similar to Immigrants from Burma/Myanmar are Samoan ($39,826, a difference of 0.0%), Japanese ($39,870, a difference of 0.11%), Cape Verdean ($39,935, a difference of 0.27%), Immigrants from Somalia ($39,974, a difference of 0.37%), and Immigrants from the Azores ($39,608, a difference of 0.55%).
| Demographics | Rating | Rank | Per Capita Income |
| German Russians | 2.2 /100 | #243 | Tragic $40,266 |
| French American Indians | 2.1 /100 | #244 | Tragic $40,244 |
| Sub-Saharan Africans | 1.9 /100 | #245 | Tragic $40,152 |
| Cree | 1.7 /100 | #246 | Tragic $40,056 |
| Immigrants | Somalia | 1.6 /100 | #247 | Tragic $39,974 |
| Cape Verdeans | 1.5 /100 | #248 | Tragic $39,935 |
| Japanese | 1.4 /100 | #249 | Tragic $39,870 |
| Immigrants | Burma/Myanmar | 1.3 /100 | #250 | Tragic $39,827 |
| Samoans | 1.3 /100 | #251 | Tragic $39,826 |
| Immigrants | Azores | 1.0 /100 | #252 | Tragic $39,608 |
| Osage | 1.0 /100 | #253 | Tragic $39,568 |
| Alaska Natives | 1.0 /100 | #254 | Tragic $39,558 |
| Immigrants | Middle Africa | 1.0 /100 | #255 | Tragic $39,529 |
| Hawaiians | 0.8 /100 | #256 | Tragic $39,403 |
| Nicaraguans | 0.8 /100 | #257 | Tragic $39,372 |
Demographics Similar to Filipinos by Per Capita Income
In terms of per capita income, the demographic groups most similar to Filipinos are Iranian ($58,786, a difference of 0.48%), Immigrants from Singapore ($58,353, a difference of 1.2%), Immigrants from Australia ($57,953, a difference of 1.9%), Immigrants from Iran ($57,759, a difference of 2.3%), and Immigrants from Taiwan ($57,742, a difference of 2.3%).
| Demographics | Rating | Rank | Per Capita Income |
| Filipinos | 100.0 /100 | #1 | Exceptional $59,066 |
| Iranians | 100.0 /100 | #2 | Exceptional $58,786 |
| Immigrants | Singapore | 100.0 /100 | #3 | Exceptional $58,353 |
| Immigrants | Australia | 100.0 /100 | #4 | Exceptional $57,953 |
| Immigrants | Iran | 100.0 /100 | #5 | Exceptional $57,759 |
| Immigrants | Taiwan | 100.0 /100 | #6 | Exceptional $57,742 |
| Immigrants | Israel | 100.0 /100 | #7 | Exceptional $57,384 |
| Immigrants | Hong Kong | 100.0 /100 | #8 | Exceptional $56,709 |
| Immigrants | Ireland | 100.0 /100 | #9 | Exceptional $56,584 |
| Okinawans | 100.0 /100 | #10 | Exceptional $55,817 |
| Eastern Europeans | 100.0 /100 | #11 | Exceptional $55,780 |
| Immigrants | Sweden | 100.0 /100 | #12 | Exceptional $55,582 |
| Immigrants | India | 100.0 /100 | #13 | Exceptional $55,268 |
| Immigrants | Belgium | 100.0 /100 | #14 | Exceptional $55,082 |
| Cypriots | 100.0 /100 | #15 | Exceptional $54,899 |