Hmong vs Scandinavian Median Household Income
COMPARE
Hmong
Scandinavian
Median Household Income
Median Household Income Comparison
Hmong
Scandinavians
$75,839
MEDIAN HOUSEHOLD INCOME
0.3/ 100
METRIC RATING
270th/ 347
METRIC RANK
$86,073
MEDIAN HOUSEHOLD INCOME
65.1/ 100
METRIC RATING
166th/ 347
METRIC RANK
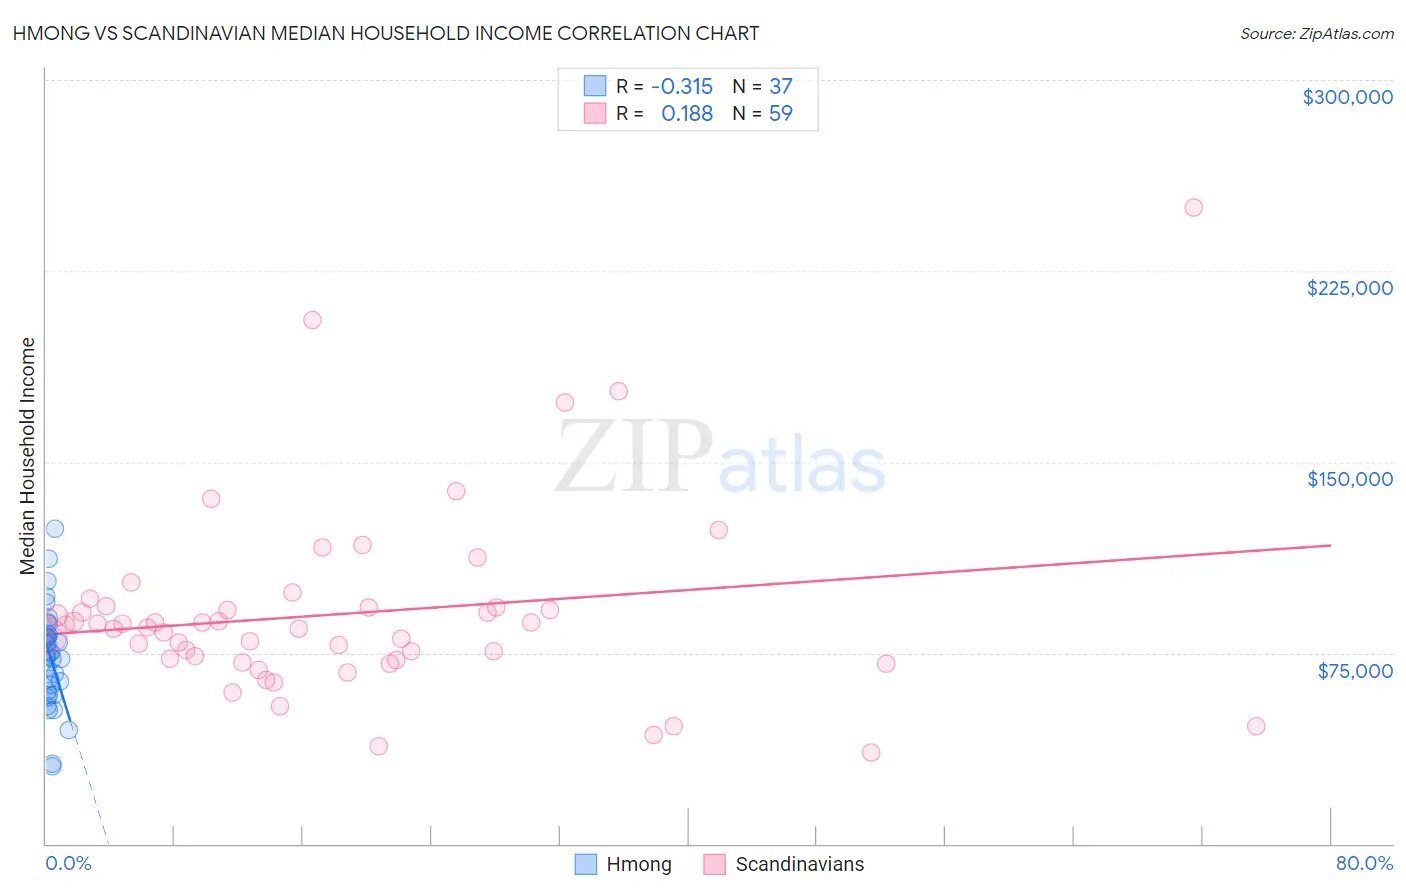
Hmong vs Scandinavian Median Household Income Correlation Chart
The statistical analysis conducted on geographies consisting of 24,655,529 people shows a mild negative correlation between the proportion of Hmong and median household income in the United States with a correlation coefficient (R) of -0.315 and weighted average of $75,839. Similarly, the statistical analysis conducted on geographies consisting of 472,110,165 people shows a poor positive correlation between the proportion of Scandinavians and median household income in the United States with a correlation coefficient (R) of 0.188 and weighted average of $86,073, a difference of 13.5%.
Median Household Income Correlation Summary
| Measurement | Hmong | Scandinavian |
| Minimum | $30,679 | $35,625 |
| Maximum | $123,750 | $250,001 |
| Range | $93,071 | $214,376 |
| Mean | $73,160 | $90,420 |
| Median | $73,828 | $84,951 |
| Interquartile 25% (IQ1) | $59,130 | $72,386 |
| Interquartile 75% (IQ3) | $82,249 | $92,885 |
| Interquartile Range (IQR) | $23,119 | $20,499 |
| Standard Deviation (Sample) | $19,589 | $37,436 |
| Standard Deviation (Population) | $19,322 | $37,118 |
Similar Demographics by Median Household Income
Demographics Similar to Hmong by Median Household Income
In terms of median household income, the demographic groups most similar to Hmong are Cape Verdean ($75,848, a difference of 0.010%), German Russian ($75,856, a difference of 0.020%), Immigrants from Jamaica ($75,851, a difference of 0.020%), Pennsylvania German ($75,814, a difference of 0.030%), and Somali ($75,782, a difference of 0.080%).
| Demographics | Rating | Rank | Median Household Income |
| Alaskan Athabascans | 0.4 /100 | #263 | Tragic $76,383 |
| Guatemalans | 0.3 /100 | #264 | Tragic $75,961 |
| Immigrants | Belize | 0.3 /100 | #265 | Tragic $75,938 |
| Americans | 0.3 /100 | #266 | Tragic $75,932 |
| German Russians | 0.3 /100 | #267 | Tragic $75,856 |
| Immigrants | Jamaica | 0.3 /100 | #268 | Tragic $75,851 |
| Cape Verdeans | 0.3 /100 | #269 | Tragic $75,848 |
| Hmong | 0.3 /100 | #270 | Tragic $75,839 |
| Pennsylvania Germans | 0.3 /100 | #271 | Tragic $75,814 |
| Somalis | 0.3 /100 | #272 | Tragic $75,782 |
| Liberians | 0.2 /100 | #273 | Tragic $75,667 |
| British West Indians | 0.2 /100 | #274 | Tragic $75,647 |
| Immigrants | Micronesia | 0.2 /100 | #275 | Tragic $75,574 |
| Immigrants | Latin America | 0.2 /100 | #276 | Tragic $75,420 |
| Spanish Americans | 0.2 /100 | #277 | Tragic $75,386 |
Demographics Similar to Scandinavians by Median Household Income
In terms of median household income, the demographic groups most similar to Scandinavians are Norwegian ($86,084, a difference of 0.010%), Irish ($86,145, a difference of 0.080%), Czech ($86,164, a difference of 0.11%), Guamanian/Chamorro ($86,255, a difference of 0.21%), and Immigrants ($85,818, a difference of 0.30%).
| Demographics | Rating | Rank | Median Household Income |
| Immigrants | Uzbekistan | 70.1 /100 | #159 | Good $86,425 |
| Luxembourgers | 70.0 /100 | #160 | Good $86,418 |
| Slavs | 69.7 /100 | #161 | Good $86,398 |
| Guamanians/Chamorros | 67.7 /100 | #162 | Good $86,255 |
| Czechs | 66.4 /100 | #163 | Good $86,164 |
| Irish | 66.2 /100 | #164 | Good $86,145 |
| Norwegians | 65.3 /100 | #165 | Good $86,084 |
| Scandinavians | 65.1 /100 | #166 | Good $86,073 |
| Immigrants | Immigrants | 61.3 /100 | #167 | Good $85,818 |
| Icelanders | 61.0 /100 | #168 | Good $85,797 |
| Colombians | 59.7 /100 | #169 | Average $85,716 |
| Swiss | 59.2 /100 | #170 | Average $85,681 |
| Immigrants | South America | 58.1 /100 | #171 | Average $85,611 |
| Slovenes | 57.4 /100 | #172 | Average $85,562 |
| Immigrants | Cameroon | 53.4 /100 | #173 | Average $85,314 |