Hmong vs Iranian Median Household Income
COMPARE
Hmong
Iranian
Median Household Income
Median Household Income Comparison
Hmong
Iranians
$75,839
MEDIAN HOUSEHOLD INCOME
0.3/ 100
METRIC RATING
270th/ 347
METRIC RANK
$109,835
MEDIAN HOUSEHOLD INCOME
100.0/ 100
METRIC RATING
7th/ 347
METRIC RANK
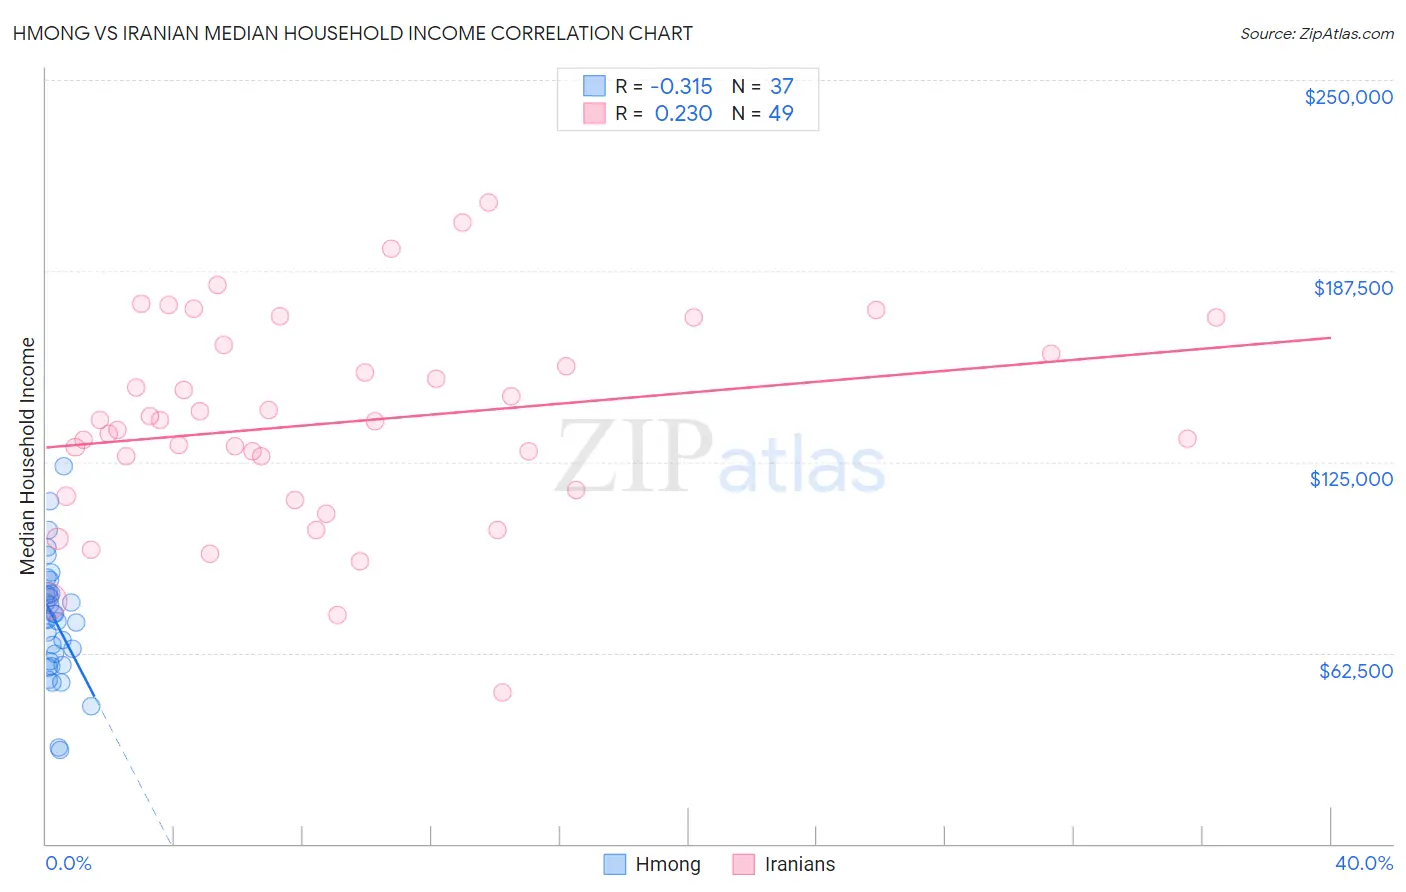
Hmong vs Iranian Median Household Income Correlation Chart
The statistical analysis conducted on geographies consisting of 24,655,529 people shows a mild negative correlation between the proportion of Hmong and median household income in the United States with a correlation coefficient (R) of -0.315 and weighted average of $75,839. Similarly, the statistical analysis conducted on geographies consisting of 316,594,709 people shows a weak positive correlation between the proportion of Iranians and median household income in the United States with a correlation coefficient (R) of 0.230 and weighted average of $109,835, a difference of 44.8%.
Median Household Income Correlation Summary
| Measurement | Hmong | Iranian |
| Minimum | $30,679 | $49,583 |
| Maximum | $123,750 | $210,000 |
| Range | $93,071 | $160,417 |
| Mean | $73,160 | $137,928 |
| Median | $73,828 | $138,452 |
| Interquartile 25% (IQ1) | $59,130 | $114,688 |
| Interquartile 75% (IQ3) | $82,249 | $161,748 |
| Interquartile Range (IQR) | $23,119 | $47,060 |
| Standard Deviation (Sample) | $19,589 | $33,663 |
| Standard Deviation (Population) | $19,322 | $33,318 |
Similar Demographics by Median Household Income
Demographics Similar to Hmong by Median Household Income
In terms of median household income, the demographic groups most similar to Hmong are Cape Verdean ($75,848, a difference of 0.010%), German Russian ($75,856, a difference of 0.020%), Immigrants from Jamaica ($75,851, a difference of 0.020%), Pennsylvania German ($75,814, a difference of 0.030%), and Somali ($75,782, a difference of 0.080%).
| Demographics | Rating | Rank | Median Household Income |
| Alaskan Athabascans | 0.4 /100 | #263 | Tragic $76,383 |
| Guatemalans | 0.3 /100 | #264 | Tragic $75,961 |
| Immigrants | Belize | 0.3 /100 | #265 | Tragic $75,938 |
| Americans | 0.3 /100 | #266 | Tragic $75,932 |
| German Russians | 0.3 /100 | #267 | Tragic $75,856 |
| Immigrants | Jamaica | 0.3 /100 | #268 | Tragic $75,851 |
| Cape Verdeans | 0.3 /100 | #269 | Tragic $75,848 |
| Hmong | 0.3 /100 | #270 | Tragic $75,839 |
| Pennsylvania Germans | 0.3 /100 | #271 | Tragic $75,814 |
| Somalis | 0.3 /100 | #272 | Tragic $75,782 |
| Liberians | 0.2 /100 | #273 | Tragic $75,667 |
| British West Indians | 0.2 /100 | #274 | Tragic $75,647 |
| Immigrants | Micronesia | 0.2 /100 | #275 | Tragic $75,574 |
| Immigrants | Latin America | 0.2 /100 | #276 | Tragic $75,420 |
| Spanish Americans | 0.2 /100 | #277 | Tragic $75,386 |
Demographics Similar to Iranians by Median Household Income
In terms of median household income, the demographic groups most similar to Iranians are Immigrants from Singapore ($110,428, a difference of 0.54%), Thai ($110,648, a difference of 0.74%), Immigrants from Hong Kong ($111,519, a difference of 1.5%), Immigrants from Iran ($108,055, a difference of 1.7%), and Immigrants from India ($113,009, a difference of 2.9%).
| Demographics | Rating | Rank | Median Household Income |
| Immigrants | Taiwan | 100.0 /100 | #1 | Exceptional $116,460 |
| Filipinos | 100.0 /100 | #2 | Exceptional $115,509 |
| Immigrants | India | 100.0 /100 | #3 | Exceptional $113,009 |
| Immigrants | Hong Kong | 100.0 /100 | #4 | Exceptional $111,519 |
| Thais | 100.0 /100 | #5 | Exceptional $110,648 |
| Immigrants | Singapore | 100.0 /100 | #6 | Exceptional $110,428 |
| Iranians | 100.0 /100 | #7 | Exceptional $109,835 |
| Immigrants | Iran | 100.0 /100 | #8 | Exceptional $108,055 |
| Okinawans | 100.0 /100 | #9 | Exceptional $106,624 |
| Immigrants | South Central Asia | 100.0 /100 | #10 | Exceptional $106,057 |
| Immigrants | China | 100.0 /100 | #11 | Exceptional $105,335 |
| Indians (Asian) | 100.0 /100 | #12 | Exceptional $105,262 |
| Immigrants | Eastern Asia | 100.0 /100 | #13 | Exceptional $104,796 |
| Immigrants | Ireland | 100.0 /100 | #14 | Exceptional $104,692 |
| Immigrants | Israel | 100.0 /100 | #15 | Exceptional $104,090 |