Iraqi vs Scandinavian Median Household Income
COMPARE
Iraqi
Scandinavian
Median Household Income
Median Household Income Comparison
Iraqis
Scandinavians
$83,753
MEDIAN HOUSEHOLD INCOME
29.6/ 100
METRIC RATING
191st/ 347
METRIC RANK
$86,073
MEDIAN HOUSEHOLD INCOME
65.1/ 100
METRIC RATING
166th/ 347
METRIC RANK
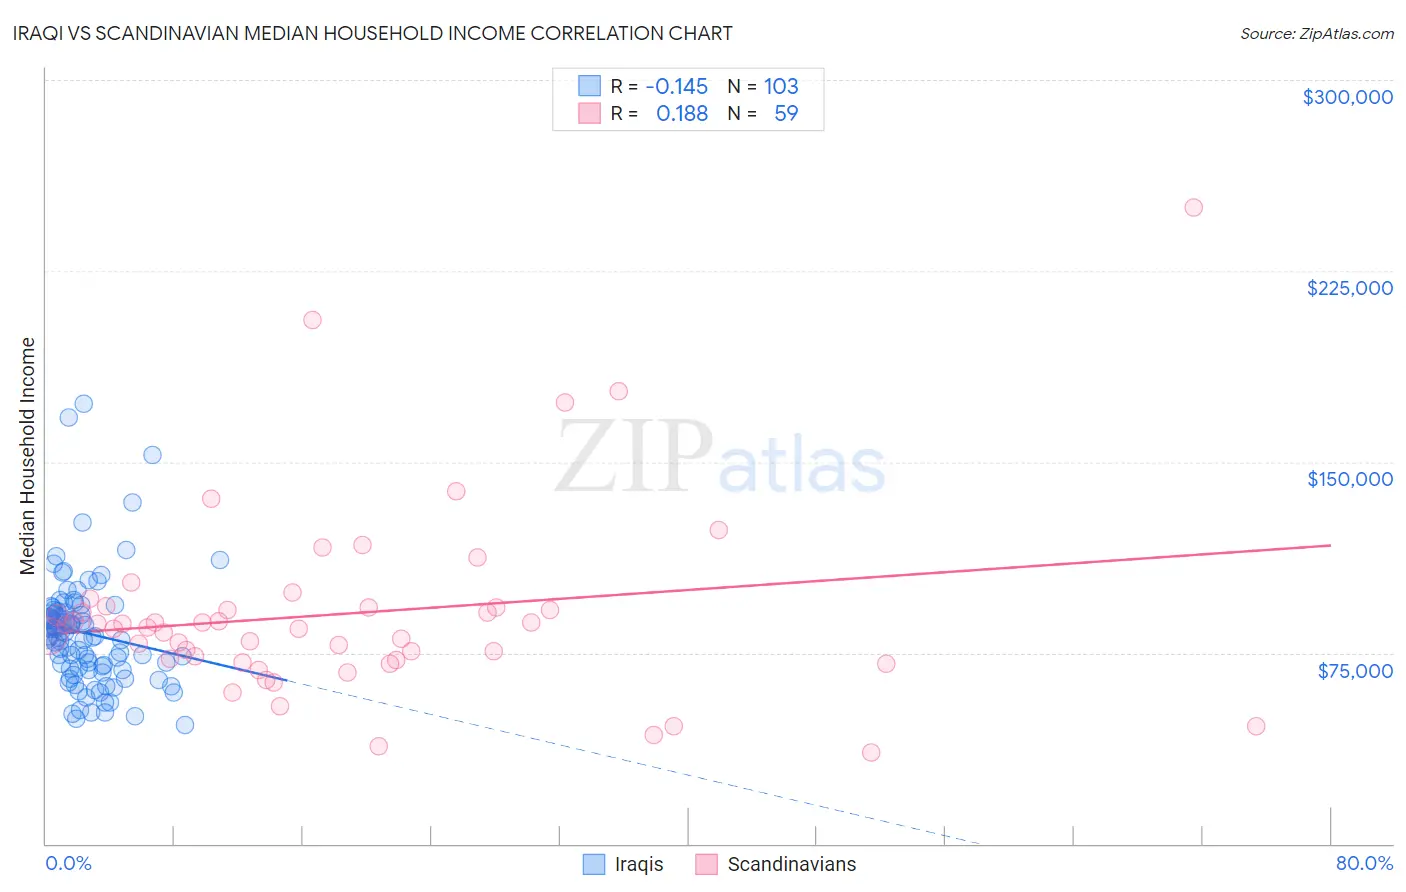
Iraqi vs Scandinavian Median Household Income Correlation Chart
The statistical analysis conducted on geographies consisting of 170,587,047 people shows a poor negative correlation between the proportion of Iraqis and median household income in the United States with a correlation coefficient (R) of -0.145 and weighted average of $83,753. Similarly, the statistical analysis conducted on geographies consisting of 472,110,165 people shows a poor positive correlation between the proportion of Scandinavians and median household income in the United States with a correlation coefficient (R) of 0.188 and weighted average of $86,073, a difference of 2.8%.
Median Household Income Correlation Summary
| Measurement | Iraqi | Scandinavian |
| Minimum | $46,565 | $35,625 |
| Maximum | $173,015 | $250,001 |
| Range | $126,450 | $214,376 |
| Mean | $82,738 | $90,420 |
| Median | $81,250 | $84,951 |
| Interquartile 25% (IQ1) | $68,093 | $72,386 |
| Interquartile 75% (IQ3) | $91,098 | $92,885 |
| Interquartile Range (IQR) | $23,005 | $20,499 |
| Standard Deviation (Sample) | $22,309 | $37,436 |
| Standard Deviation (Population) | $22,201 | $37,118 |
Similar Demographics by Median Household Income
Demographics Similar to Iraqis by Median Household Income
In terms of median household income, the demographic groups most similar to Iraqis are Slovak ($83,798, a difference of 0.050%), Welsh ($83,628, a difference of 0.15%), Immigrants from Colombia ($83,902, a difference of 0.18%), Finnish ($83,607, a difference of 0.18%), and Ghanaian ($83,582, a difference of 0.21%).
| Demographics | Rating | Rank | Median Household Income |
| Immigrants | Eastern Africa | 37.4 /100 | #184 | Fair $84,299 |
| Kenyans | 34.2 /100 | #185 | Fair $84,085 |
| Puget Sound Salish | 33.2 /100 | #186 | Fair $84,011 |
| Belgians | 33.2 /100 | #187 | Fair $84,008 |
| Tlingit-Haida | 32.6 /100 | #188 | Fair $83,968 |
| Immigrants | Colombia | 31.7 /100 | #189 | Fair $83,902 |
| Slovaks | 30.2 /100 | #190 | Fair $83,798 |
| Iraqis | 29.6 /100 | #191 | Fair $83,753 |
| Welsh | 28.0 /100 | #192 | Fair $83,628 |
| Finns | 27.7 /100 | #193 | Fair $83,607 |
| Ghanaians | 27.4 /100 | #194 | Fair $83,582 |
| Immigrants | Armenia | 27.0 /100 | #195 | Fair $83,555 |
| French | 26.0 /100 | #196 | Fair $83,468 |
| Aleuts | 25.7 /100 | #197 | Fair $83,446 |
| Japanese | 25.1 /100 | #198 | Fair $83,395 |
Demographics Similar to Scandinavians by Median Household Income
In terms of median household income, the demographic groups most similar to Scandinavians are Norwegian ($86,084, a difference of 0.010%), Irish ($86,145, a difference of 0.080%), Czech ($86,164, a difference of 0.11%), Guamanian/Chamorro ($86,255, a difference of 0.21%), and Immigrants ($85,818, a difference of 0.30%).
| Demographics | Rating | Rank | Median Household Income |
| Immigrants | Uzbekistan | 70.1 /100 | #159 | Good $86,425 |
| Luxembourgers | 70.0 /100 | #160 | Good $86,418 |
| Slavs | 69.7 /100 | #161 | Good $86,398 |
| Guamanians/Chamorros | 67.7 /100 | #162 | Good $86,255 |
| Czechs | 66.4 /100 | #163 | Good $86,164 |
| Irish | 66.2 /100 | #164 | Good $86,145 |
| Norwegians | 65.3 /100 | #165 | Good $86,084 |
| Scandinavians | 65.1 /100 | #166 | Good $86,073 |
| Immigrants | Immigrants | 61.3 /100 | #167 | Good $85,818 |
| Icelanders | 61.0 /100 | #168 | Good $85,797 |
| Colombians | 59.7 /100 | #169 | Average $85,716 |
| Swiss | 59.2 /100 | #170 | Average $85,681 |
| Immigrants | South America | 58.1 /100 | #171 | Average $85,611 |
| Slovenes | 57.4 /100 | #172 | Average $85,562 |
| Immigrants | Cameroon | 53.4 /100 | #173 | Average $85,314 |