Hmong vs Immigrants from Australia Median Household Income
COMPARE
Hmong
Immigrants from Australia
Median Household Income
Median Household Income Comparison
Hmong
Immigrants from Australia
$75,839
MEDIAN HOUSEHOLD INCOME
0.3/ 100
METRIC RATING
270th/ 347
METRIC RANK
$102,562
MEDIAN HOUSEHOLD INCOME
100.0/ 100
METRIC RATING
19th/ 347
METRIC RANK
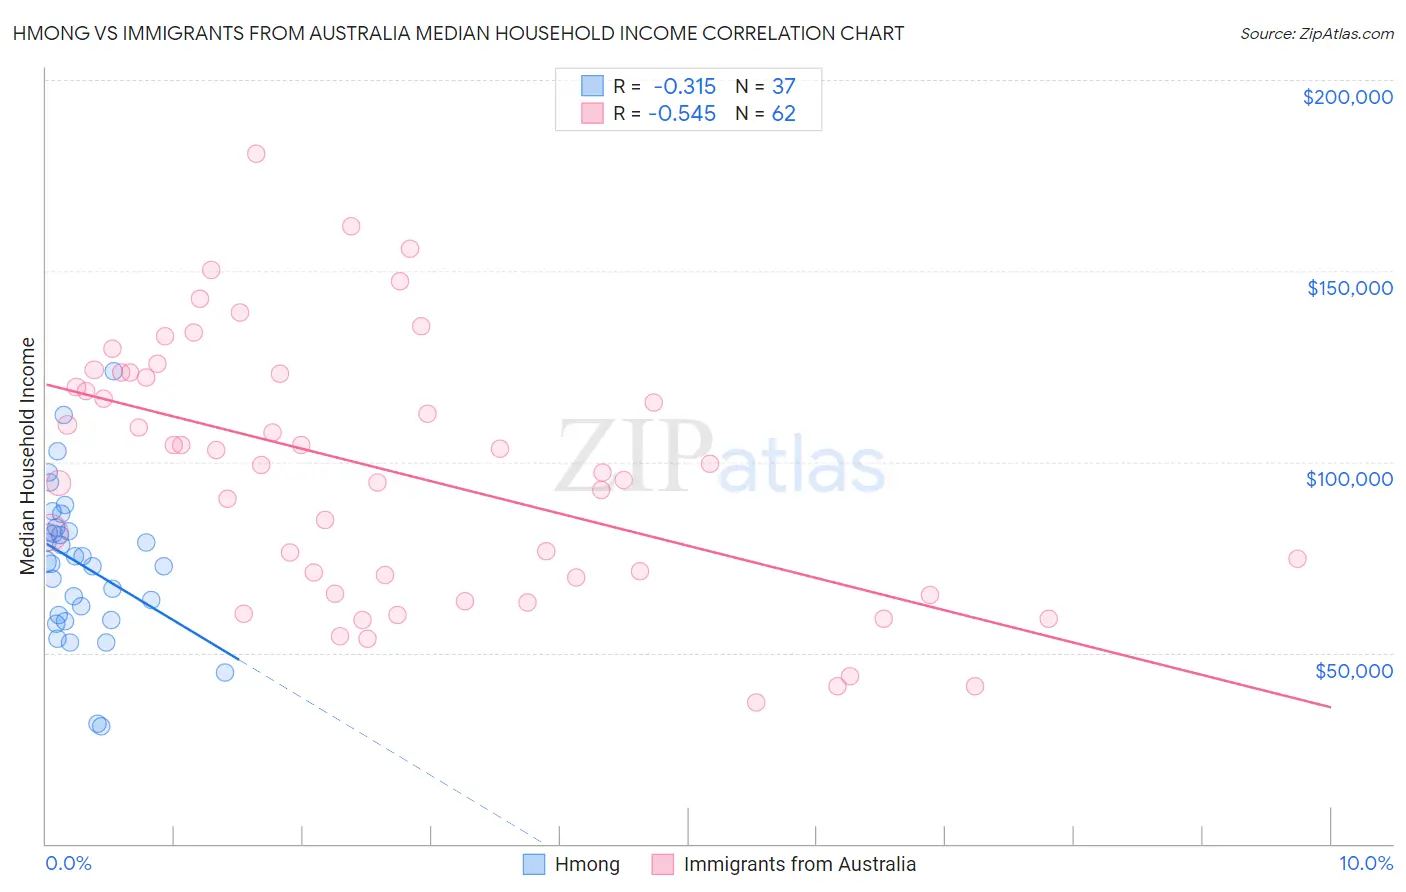
Hmong vs Immigrants from Australia Median Household Income Correlation Chart
The statistical analysis conducted on geographies consisting of 24,655,529 people shows a mild negative correlation between the proportion of Hmong and median household income in the United States with a correlation coefficient (R) of -0.315 and weighted average of $75,839. Similarly, the statistical analysis conducted on geographies consisting of 227,116,578 people shows a substantial negative correlation between the proportion of Immigrants from Australia and median household income in the United States with a correlation coefficient (R) of -0.545 and weighted average of $102,562, a difference of 35.2%.
Median Household Income Correlation Summary
| Measurement | Hmong | Immigrants from Australia |
| Minimum | $30,679 | $36,932 |
| Maximum | $123,750 | $180,529 |
| Range | $93,071 | $143,597 |
| Mean | $73,160 | $97,516 |
| Median | $73,828 | $99,226 |
| Interquartile 25% (IQ1) | $59,130 | $69,750 |
| Interquartile 75% (IQ3) | $82,249 | $123,199 |
| Interquartile Range (IQR) | $23,119 | $53,449 |
| Standard Deviation (Sample) | $19,589 | $33,443 |
| Standard Deviation (Population) | $19,322 | $33,173 |
Similar Demographics by Median Household Income
Demographics Similar to Hmong by Median Household Income
In terms of median household income, the demographic groups most similar to Hmong are Cape Verdean ($75,848, a difference of 0.010%), German Russian ($75,856, a difference of 0.020%), Immigrants from Jamaica ($75,851, a difference of 0.020%), Pennsylvania German ($75,814, a difference of 0.030%), and Somali ($75,782, a difference of 0.080%).
| Demographics | Rating | Rank | Median Household Income |
| Alaskan Athabascans | 0.4 /100 | #263 | Tragic $76,383 |
| Guatemalans | 0.3 /100 | #264 | Tragic $75,961 |
| Immigrants | Belize | 0.3 /100 | #265 | Tragic $75,938 |
| Americans | 0.3 /100 | #266 | Tragic $75,932 |
| German Russians | 0.3 /100 | #267 | Tragic $75,856 |
| Immigrants | Jamaica | 0.3 /100 | #268 | Tragic $75,851 |
| Cape Verdeans | 0.3 /100 | #269 | Tragic $75,848 |
| Hmong | 0.3 /100 | #270 | Tragic $75,839 |
| Pennsylvania Germans | 0.3 /100 | #271 | Tragic $75,814 |
| Somalis | 0.3 /100 | #272 | Tragic $75,782 |
| Liberians | 0.2 /100 | #273 | Tragic $75,667 |
| British West Indians | 0.2 /100 | #274 | Tragic $75,647 |
| Immigrants | Micronesia | 0.2 /100 | #275 | Tragic $75,574 |
| Immigrants | Latin America | 0.2 /100 | #276 | Tragic $75,420 |
| Spanish Americans | 0.2 /100 | #277 | Tragic $75,386 |
Demographics Similar to Immigrants from Australia by Median Household Income
In terms of median household income, the demographic groups most similar to Immigrants from Australia are Cypriot ($102,843, a difference of 0.27%), Bolivian ($102,195, a difference of 0.36%), Immigrants from Korea ($102,962, a difference of 0.39%), Burmese ($103,145, a difference of 0.57%), and Eastern European ($101,781, a difference of 0.77%).
| Demographics | Rating | Rank | Median Household Income |
| Indians (Asian) | 100.0 /100 | #12 | Exceptional $105,262 |
| Immigrants | Eastern Asia | 100.0 /100 | #13 | Exceptional $104,796 |
| Immigrants | Ireland | 100.0 /100 | #14 | Exceptional $104,692 |
| Immigrants | Israel | 100.0 /100 | #15 | Exceptional $104,090 |
| Burmese | 100.0 /100 | #16 | Exceptional $103,145 |
| Immigrants | Korea | 100.0 /100 | #17 | Exceptional $102,962 |
| Cypriots | 100.0 /100 | #18 | Exceptional $102,843 |
| Immigrants | Australia | 100.0 /100 | #19 | Exceptional $102,562 |
| Bolivians | 100.0 /100 | #20 | Exceptional $102,195 |
| Eastern Europeans | 100.0 /100 | #21 | Exceptional $101,781 |
| Asians | 100.0 /100 | #22 | Exceptional $101,681 |
| Immigrants | Bolivia | 100.0 /100 | #23 | Exceptional $101,394 |
| Immigrants | Japan | 100.0 /100 | #24 | Exceptional $100,711 |
| Immigrants | Sweden | 100.0 /100 | #25 | Exceptional $100,699 |
| Immigrants | Belgium | 100.0 /100 | #26 | Exceptional $100,306 |