Chippewa vs Iranian Median Household Income

COMPARE

Chippewa
Race
Ancestry
AfghanAfricanAlaska NativeAlaskan AthabascanAlbanianAleutAlsatianAmericanApacheArabArapahoArgentineanArmenianAssyrian/Chaldean/SyriacAustralianAustrianBahamianBangladeshiBarbadianBasqueBelgianBelizeanBermudanBhutaneseBlackfeetBolivianBrazilianBritishBritish West IndianBulgarianBurmeseCajunCambodianCanadianCape VerdeanCarpatho RusynCelticCentral AmericanCentral American IndianCherokeeCheyenneChickasawChileanChineseChippewaChoctawColombianColvilleComancheCosta RicanCreeCreekCroatianCrowCubanCypriotCzechCzechoslovakianDanishDelawareDominicanDutchDutch West IndianEastern EuropeanEcuadorianEgyptianEnglishEstonianEthiopianEuropeanFijianFilipinoFinnishFrenchFrench American IndianFrench CanadianGermanGerman RussianGhanaianGreekGuamanian/ChamorroGuatemalanGuyaneseHaitianHmongHonduranHopiHoumaHungarianIcelanderIndian (Asian)IndonesianInupiatIraqiIrishIroquoisIsraeliItalianJamaicanJapaneseJordanianKenyanKiowaKoreanLaotianLatvianLebaneseLiberianLithuanianLumbeeLuxembourgerMacedonianMalaysianMalteseMarshalleseMenomineeMexicanMexican American IndianMongolianMoroccanNative HawaiianNavajoNepaleseNew ZealanderNicaraguanNigerianNorthern EuropeanNorwegianOkinawanOsageOttawaPaiutePakistaniPalestinianPanamanianParaguayanPennsylvania GermanPeruvianPimaPolishPortuguesePotawatomiPuebloPuerto RicanPuget Sound SalishRomanianRussianSalvadoranSamoanScandinavianScotch-IrishScottishSeminoleSenegaleseSerbianShoshoneSierra LeoneanSiouxSlavicSlovakSloveneSomaliSouth AfricanSouth AmericanSouth American IndianSoviet UnionSpaniardSpanishSpanish AmericanSpanish American IndianSri LankanSubsaharan AfricanSudaneseSwedishSwissSyrianTaiwaneseThaiTlingit-HaidaTohono O'OdhamTonganTrinidadian and TobagonianTsimshianTurkishU.S. Virgin IslanderUgandanUkrainianUruguayanUteVenezuelanVietnameseWelshWest IndianYakamaYaquiYugoslavianYumanYup'ikZimbabwean
Immigration
NonimmigrantsImmigrantsAfghanistanAfricaAlbaniaArgentinaArmeniaAsiaAustraliaAustriaBahamasBangladeshBarbadosBelarusBelgiumBelizeBoliviaBosnia and HerzegovinaBrazilBulgariaBurma/MyanmarCabo VerdeCambodiaCameroonCanadaCaribbeanCentral AmericaChileChinaColombiaCongoCosta RicaCroatiaCubaCzechoslovakiaDenmarkDominicaDominican RepublicEastern AfricaEastern AsiaEastern EuropeEcuadorEgyptEl SalvadorEnglandEritreaEthiopiaEuropeFijiFranceGermanyGhanaGreeceGrenadaGuatemalaGuyanaHaitiHondurasHong KongHungaryIndiaIndonesiaIranIraqIrelandIsraelItalyJamaicaJapanJordanKazakhstanKenyaKoreaKuwaitLaosLatin AmericaLatviaLebanonLiberiaLithuaniaMalaysiaMexicoMicronesiaMiddle AfricaMoldovaMoroccoNepalNetherlandsNicaraguaNigeriaNorth AmericaNorth MacedoniaNorthern AfricaNorthern EuropeNorwayOceaniaPakistanPanamaPeruPhilippinesPolandPortugalRomaniaRussiaSaudi ArabiaScotlandSenegalSerbiaSierra LeoneSingaporeSomaliaSouth AfricaSouth AmericaSouth Central AsiaSouth Eastern AsiaSouthern EuropeSpainSri LankaSt. Vincent and the GrenadinesSudanSwedenSwitzerlandSyriaTaiwanThailandTrinidad and TobagoTurkeyUgandaUkraineUruguayUzbekistanVenezuelaVietnamWest IndiesWestern AfricaWestern AsiaWestern EuropeYemenZaireZimbabweAzores
Iranian
Race
Ancestry
AfghanAfricanAlaska NativeAlaskan AthabascanAlbanianAleutAlsatianAmericanApacheArabArapahoArgentineanArmenianAssyrian/Chaldean/SyriacAustralianAustrianBahamianBangladeshiBarbadianBasqueBelgianBelizeanBermudanBhutaneseBlackfeetBolivianBrazilianBritishBritish West IndianBulgarianBurmeseCajunCambodianCanadianCape VerdeanCarpatho RusynCelticCentral AmericanCentral American IndianCherokeeCheyenneChickasawChileanChineseChoctawColombianColvilleComancheCosta RicanCreeCreekCroatianCrowCubanCypriotCzechCzechoslovakianDanishDelawareDominicanDutchDutch West IndianEastern EuropeanEcuadorianEgyptianEnglishEstonianEthiopianEuropeanFijianFilipinoFinnishFrenchFrench American IndianFrench CanadianGermanGerman RussianGhanaianGreekGuamanian/ChamorroGuatemalanGuyaneseHaitianHmongHonduranHopiHoumaHungarianIcelanderIndian (Asian)IndonesianInupiatIranianIraqiIrishIroquoisIsraeliItalianJamaicanJapaneseJordanianKenyanKiowaKoreanLaotianLatvianLebaneseLiberianLithuanianLumbeeLuxembourgerMacedonianMalaysianMalteseMarshalleseMenomineeMexicanMexican American IndianMongolianMoroccanNative HawaiianNavajoNepaleseNew ZealanderNicaraguanNigerianNorthern EuropeanNorwegianOkinawanOsageOttawaPaiutePakistaniPalestinianPanamanianParaguayanPennsylvania GermanPeruvianPimaPolishPortuguesePotawatomiPuebloPuerto RicanPuget Sound SalishRomanianRussianSalvadoranSamoanScandinavianScotch-IrishScottishSeminoleSenegaleseSerbianShoshoneSierra LeoneanSiouxSlavicSlovakSloveneSomaliSouth AfricanSouth AmericanSouth American IndianSoviet UnionSpaniardSpanishSpanish AmericanSpanish American IndianSri LankanSubsaharan AfricanSudaneseSwedishSwissSyrianTaiwaneseThaiTlingit-HaidaTohono O'OdhamTonganTrinidadian and TobagonianTsimshianTurkishU.S. Virgin IslanderUgandanUkrainianUruguayanUteVenezuelanVietnameseWelshWest IndianYakamaYaquiYugoslavianYumanYup'ikZimbabwean
Immigration
NonimmigrantsImmigrantsAfghanistanAfricaAlbaniaArgentinaArmeniaAsiaAustraliaAustriaBahamasBangladeshBarbadosBelarusBelgiumBelizeBoliviaBosnia and HerzegovinaBrazilBulgariaBurma/MyanmarCabo VerdeCambodiaCameroonCanadaCaribbeanCentral AmericaChileChinaColombiaCongoCosta RicaCroatiaCubaCzechoslovakiaDenmarkDominicaDominican RepublicEastern AfricaEastern AsiaEastern EuropeEcuadorEgyptEl SalvadorEnglandEritreaEthiopiaEuropeFijiFranceGermanyGhanaGreeceGrenadaGuatemalaGuyanaHaitiHondurasHong KongHungaryIndiaIndonesiaIranIraqIrelandIsraelItalyJamaicaJapanJordanKazakhstanKenyaKoreaKuwaitLaosLatin AmericaLatviaLebanonLiberiaLithuaniaMalaysiaMexicoMicronesiaMiddle AfricaMoldovaMoroccoNepalNetherlandsNicaraguaNigeriaNorth AmericaNorth MacedoniaNorthern AfricaNorthern EuropeNorwayOceaniaPakistanPanamaPeruPhilippinesPolandPortugalRomaniaRussiaSaudi ArabiaScotlandSenegalSerbiaSierra LeoneSingaporeSomaliaSouth AfricaSouth AmericaSouth Central AsiaSouth Eastern AsiaSouthern EuropeSpainSri LankaSt. Vincent and the GrenadinesSudanSwedenSwitzerlandSyriaTaiwanThailandTrinidad and TobagoTurkeyUgandaUkraineUruguayUzbekistanVenezuelaVietnamWest IndiesWestern AfricaWestern AsiaWestern EuropeYemenZaireZimbabweAzores
Median Household Income
Income
Poverty
Unemployment
Labor Participation
Family Structure
Vehicle Availability
Education Level
Disability

Median Household Income Comparison

Chippewa

Iranians

Tragic
Exceptional
$70,539
MEDIAN HOUSEHOLD INCOME
0.0/ 100
METRIC RATING
318th/ 347
METRIC RANK
$109,835
MEDIAN HOUSEHOLD INCOME
100.0/ 100
METRIC RATING
7th/ 347
METRIC RANK

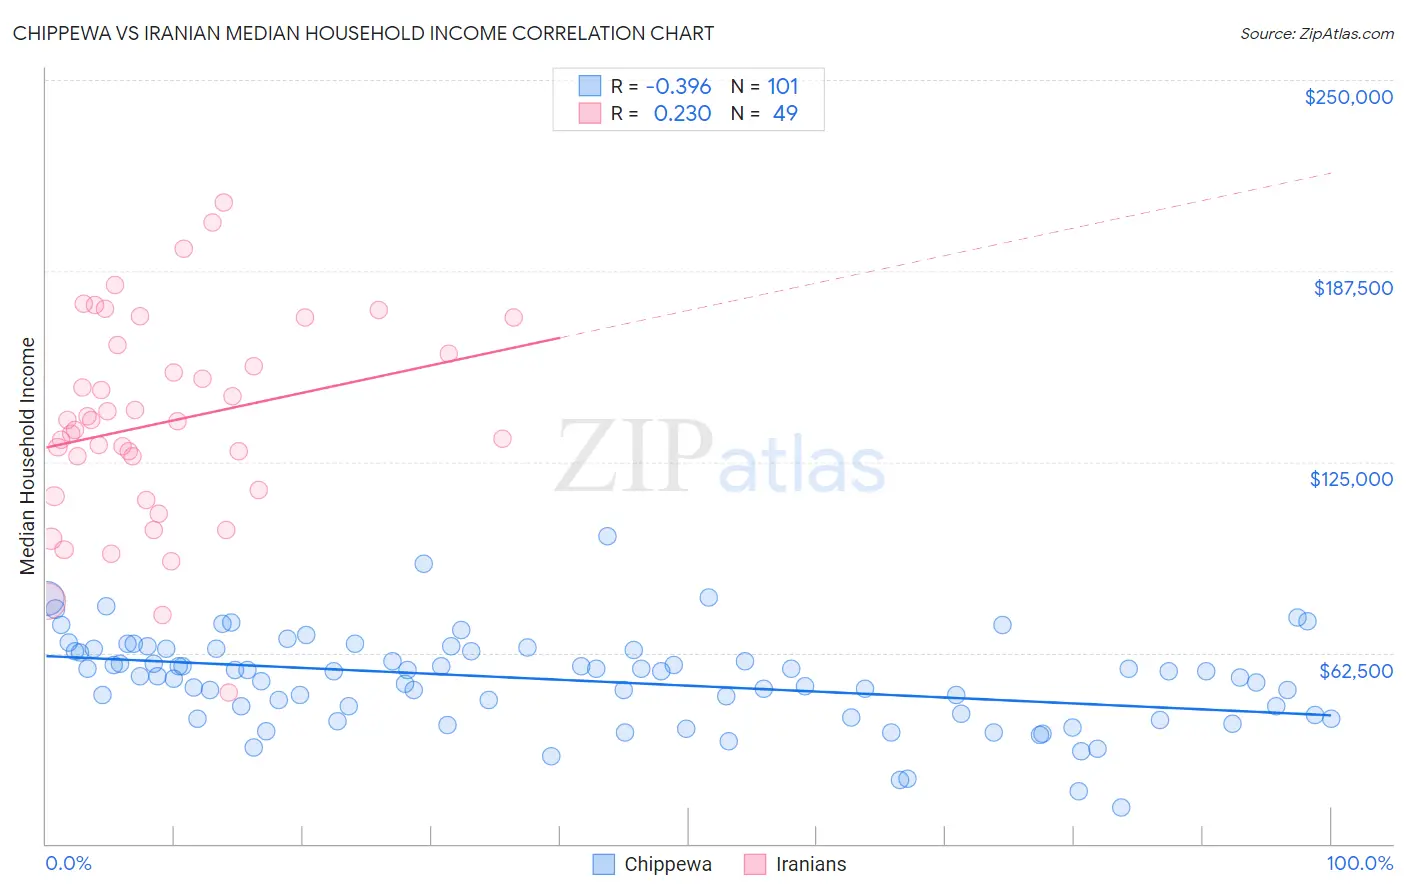
Chippewa vs Iranian Median Household Income Correlation Chart

The statistical analysis conducted on geographies consisting of 214,988,479 people shows a mild negative correlation between the proportion of Chippewa and median household income in the United States with a correlation coefficient (R) of -0.396 and weighted average of $70,539. Similarly, the statistical analysis conducted on geographies consisting of 316,594,709 people shows a weak positive correlation between the proportion of Iranians and median household income in the United States with a correlation coefficient (R) of 0.230 and weighted average of $109,835, a difference of 55.7%.
Chippewa vs Iranian Median Household Income

Median Household Income Correlation Summary

MeasurementChippewaIranian
Minimum$12,000$49,583
Maximum$100,625$210,000
Range$88,625$160,417
Mean$53,554$137,928
Median$56,473$138,452
Interquartile 25% (IQ1)$42,264$114,688
Interquartile 75% (IQ3)$63,716$161,748
Interquartile Range (IQR)$21,452$47,060
Standard Deviation (Sample)$15,182$33,663
Standard Deviation (Population)$15,107$33,318

Similar Demographics by Median Household Income

Demographics Similar to Chippewa by Median Household Income

In terms of median household income, the demographic groups most similar to Chippewa are Cajun ($70,605, a difference of 0.090%), Immigrants from Dominican Republic ($70,208, a difference of 0.47%), Apache ($70,927, a difference of 0.55%), Ottawa ($70,984, a difference of 0.63%), and Colville ($70,094, a difference of 0.63%).
DemographicsRating | RankMedian Household Income
Immigrants | Zaire
0.0
/100
|
#311
Tragic
$71,801
Immigrants | Honduras
0.0
/100
|
#312
Tragic
$71,452
Immigrants | Bahamas
0.0
/100
|
#313
Tragic
$71,349
Dominicans
0.0
/100
|
#314
Tragic
$71,302
Ottawa
0.0
/100
|
#315
Tragic
$70,984
Apache
0.0
/100
|
#316
Tragic
$70,927
Cajuns
0.0
/100
|
#317
Tragic
$70,605
Chippewa
0.0
/100
|
#318
Tragic
$70,539
Immigrants | Dominican Republic
0.0
/100
|
#319
Tragic
$70,208
Colville
0.0
/100
|
#320
Tragic
$70,094
Chickasaw
0.0
/100
|
#321
Tragic
$70,005
Choctaw
0.0
/100
|
#322
Tragic
$69,947
Bahamians
0.0
/100
|
#323
Tragic
$69,726
Yup'ik
0.0
/100
|
#324
Tragic
$69,695
Seminole
0.0
/100
|
#325
Tragic
$69,420

Demographics Similar to Iranians by Median Household Income

In terms of median household income, the demographic groups most similar to Iranians are Immigrants from Singapore ($110,428, a difference of 0.54%), Thai ($110,648, a difference of 0.74%), Immigrants from Hong Kong ($111,519, a difference of 1.5%), Immigrants from Iran ($108,055, a difference of 1.7%), and Immigrants from India ($113,009, a difference of 2.9%).
DemographicsRating | RankMedian Household Income
Immigrants | Taiwan
100.0
/100
|
#1
Exceptional
$116,460
Filipinos
100.0
/100
|
#2
Exceptional
$115,509
Immigrants | India
100.0
/100
|
#3
Exceptional
$113,009
Immigrants | Hong Kong
100.0
/100
|
#4
Exceptional
$111,519
Thais
100.0
/100
|
#5
Exceptional
$110,648
Immigrants | Singapore
100.0
/100
|
#6
Exceptional
$110,428
Iranians
100.0
/100
|
#7
Exceptional
$109,835
Immigrants | Iran
100.0
/100
|
#8
Exceptional
$108,055
Okinawans
100.0
/100
|
#9
Exceptional
$106,624
Immigrants | South Central Asia
100.0
/100
|
#10
Exceptional
$106,057
Immigrants | China
100.0
/100
|
#11
Exceptional
$105,335
Indians (Asian)
100.0
/100
|
#12
Exceptional
$105,262
Immigrants | Eastern Asia
100.0
/100
|
#13
Exceptional
$104,796
Immigrants | Ireland
100.0
/100
|
#14
Exceptional
$104,692
Immigrants | Israel
100.0
/100
|
#15
Exceptional
$104,090