Arapaho vs Immigrants from Ethiopia Per Capita Income
COMPARE
Arapaho
Immigrants from Ethiopia
Per Capita Income
Per Capita Income Comparison
Arapaho
Immigrants from Ethiopia
$32,345
PER CAPITA INCOME
0.0/ 100
METRIC RATING
338th/ 347
METRIC RANK
$45,923
PER CAPITA INCOME
92.7/ 100
METRIC RATING
120th/ 347
METRIC RANK
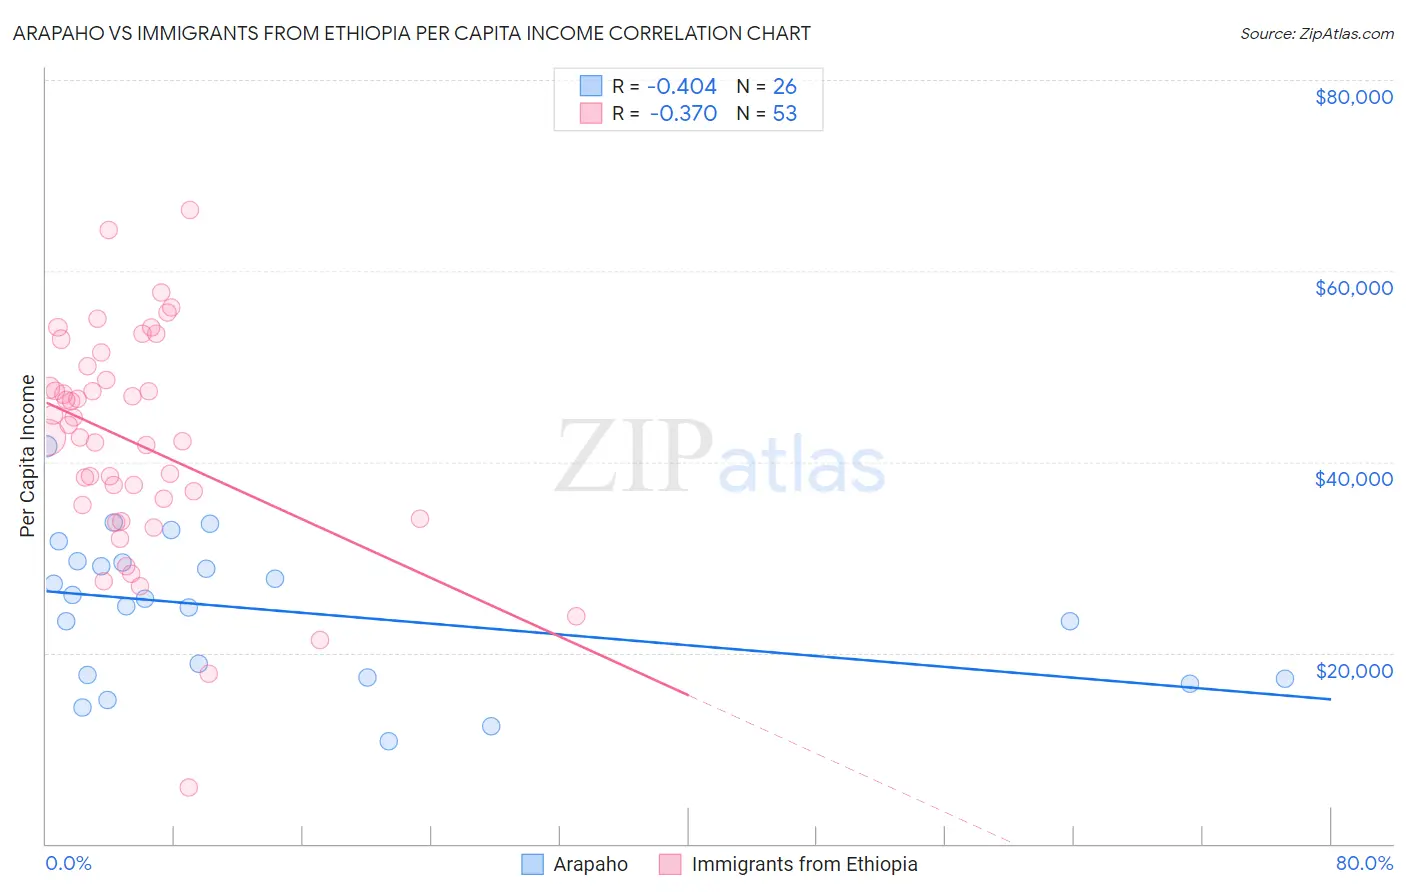
Arapaho vs Immigrants from Ethiopia Per Capita Income Correlation Chart
The statistical analysis conducted on geographies consisting of 29,780,267 people shows a moderate negative correlation between the proportion of Arapaho and per capita income in the United States with a correlation coefficient (R) of -0.404 and weighted average of $32,345. Similarly, the statistical analysis conducted on geographies consisting of 211,574,891 people shows a mild negative correlation between the proportion of Immigrants from Ethiopia and per capita income in the United States with a correlation coefficient (R) of -0.370 and weighted average of $45,923, a difference of 42.0%.
Per Capita Income Correlation Summary
| Measurement | Arapaho | Immigrants from Ethiopia |
| Minimum | $10,798 | $5,866 |
| Maximum | $41,687 | $66,352 |
| Range | $30,889 | $60,486 |
| Mean | $24,378 | $42,004 |
| Median | $25,279 | $42,502 |
| Interquartile 25% (IQ1) | $17,440 | $34,771 |
| Interquartile 75% (IQ3) | $29,495 | $49,297 |
| Interquartile Range (IQR) | $12,055 | $14,526 |
| Standard Deviation (Sample) | $7,667 | $11,622 |
| Standard Deviation (Population) | $7,518 | $11,512 |
Similar Demographics by Per Capita Income
Demographics Similar to Arapaho by Per Capita Income
In terms of per capita income, the demographic groups most similar to Arapaho are Pueblo ($32,012, a difference of 1.0%), Crow ($31,729, a difference of 1.9%), Houma ($32,996, a difference of 2.0%), Yakama ($33,009, a difference of 2.1%), and Yuman ($33,236, a difference of 2.8%).
| Demographics | Rating | Rank | Per Capita Income |
| Immigrants | Mexico | 0.0 /100 | #331 | Tragic $33,931 |
| Sioux | 0.0 /100 | #332 | Tragic $33,921 |
| Immigrants | Yemen | 0.0 /100 | #333 | Tragic $33,696 |
| Natives/Alaskans | 0.0 /100 | #334 | Tragic $33,279 |
| Yuman | 0.0 /100 | #335 | Tragic $33,236 |
| Yakama | 0.0 /100 | #336 | Tragic $33,009 |
| Houma | 0.0 /100 | #337 | Tragic $32,996 |
| Arapaho | 0.0 /100 | #338 | Tragic $32,345 |
| Pueblo | 0.0 /100 | #339 | Tragic $32,012 |
| Crow | 0.0 /100 | #340 | Tragic $31,729 |
| Puerto Ricans | 0.0 /100 | #341 | Tragic $31,268 |
| Hopi | 0.0 /100 | #342 | Tragic $31,177 |
| Pima | 0.0 /100 | #343 | Tragic $30,644 |
| Yup'ik | 0.0 /100 | #344 | Tragic $30,518 |
| Tohono O'odham | 0.0 /100 | #345 | Tragic $30,256 |
Demographics Similar to Immigrants from Ethiopia by Per Capita Income
In terms of per capita income, the demographic groups most similar to Immigrants from Ethiopia are Immigrants from Poland ($45,979, a difference of 0.12%), Canadian ($45,858, a difference of 0.14%), Moroccan ($45,854, a difference of 0.15%), Lebanese ($45,840, a difference of 0.18%), and Immigrants from Saudi Arabia ($46,008, a difference of 0.19%).
| Demographics | Rating | Rank | Per Capita Income |
| Immigrants | Albania | 95.5 /100 | #113 | Exceptional $46,387 |
| Afghans | 94.9 /100 | #114 | Exceptional $46,268 |
| Immigrants | Chile | 94.6 /100 | #115 | Exceptional $46,213 |
| Poles | 94.1 /100 | #116 | Exceptional $46,123 |
| Chinese | 93.9 /100 | #117 | Exceptional $46,098 |
| Immigrants | Saudi Arabia | 93.3 /100 | #118 | Exceptional $46,008 |
| Immigrants | Poland | 93.1 /100 | #119 | Exceptional $45,979 |
| Immigrants | Ethiopia | 92.7 /100 | #120 | Exceptional $45,923 |
| Canadians | 92.2 /100 | #121 | Exceptional $45,858 |
| Moroccans | 92.1 /100 | #122 | Exceptional $45,854 |
| Lebanese | 92.0 /100 | #123 | Exceptional $45,840 |
| Europeans | 92.0 /100 | #124 | Exceptional $45,836 |
| Zimbabweans | 91.7 /100 | #125 | Exceptional $45,804 |
| Palestinians | 91.6 /100 | #126 | Exceptional $45,790 |
| Immigrants | Germany | 91.3 /100 | #127 | Exceptional $45,751 |