Hmong vs Immigrants from Australia Family Poverty
COMPARE
Hmong
Immigrants from Australia
Family Poverty
Family Poverty Comparison
Hmong
Immigrants from Australia
9.1%
FAMILY POVERTY
40.2/ 100
METRIC RATING
181st/ 347
METRIC RANK
7.6%
FAMILY POVERTY
99.2/ 100
METRIC RATING
41st/ 347
METRIC RANK
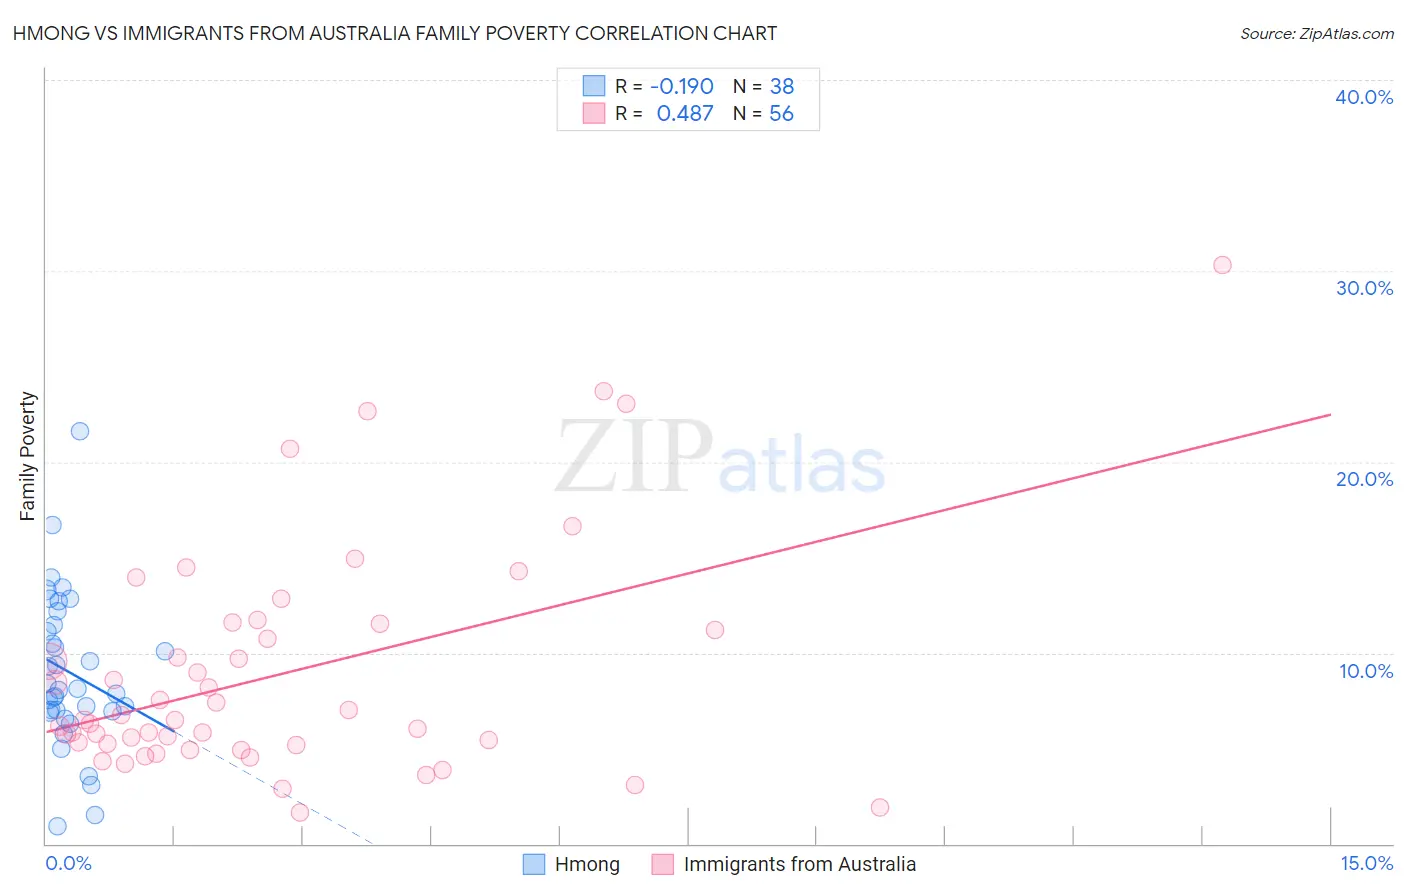
Hmong vs Immigrants from Australia Family Poverty Correlation Chart
The statistical analysis conducted on geographies consisting of 24,669,739 people shows a poor negative correlation between the proportion of Hmong and poverty level among families in the United States with a correlation coefficient (R) of -0.190 and weighted average of 9.1%. Similarly, the statistical analysis conducted on geographies consisting of 226,808,313 people shows a moderate positive correlation between the proportion of Immigrants from Australia and poverty level among families in the United States with a correlation coefficient (R) of 0.487 and weighted average of 7.6%, a difference of 20.5%.
Family Poverty Correlation Summary
| Measurement | Hmong | Immigrants from Australia |
| Minimum | 0.91% | 1.7% |
| Maximum | 21.6% | 30.3% |
| Range | 20.7% | 28.6% |
| Mean | 9.0% | 8.9% |
| Median | 8.1% | 6.5% |
| Interquartile 25% (IQ1) | 7.0% | 5.2% |
| Interquartile 75% (IQ3) | 11.4% | 11.4% |
| Interquartile Range (IQR) | 4.5% | 6.2% |
| Standard Deviation (Sample) | 4.1% | 6.0% |
| Standard Deviation (Population) | 4.0% | 5.9% |
Similar Demographics by Family Poverty
Demographics Similar to Hmong by Family Poverty
In terms of family poverty, the demographic groups most similar to Hmong are Immigrants from Morocco (9.1%, a difference of 0.010%), Uruguayan (9.1%, a difference of 0.14%), South American Indian (9.1%, a difference of 0.21%), Immigrants from Saudi Arabia (9.1%, a difference of 0.22%), and Immigrants from Uganda (9.1%, a difference of 0.43%).
| Demographics | Rating | Rank | Family Poverty |
| Immigrants | Albania | 50.0 /100 | #174 | Average 9.0% |
| Costa Ricans | 49.3 /100 | #175 | Average 9.0% |
| Immigrants | Syria | 47.5 /100 | #176 | Average 9.0% |
| Hawaiians | 47.2 /100 | #177 | Average 9.0% |
| Immigrants | Cameroon | 47.1 /100 | #178 | Average 9.0% |
| Immigrants | Iraq | 44.4 /100 | #179 | Average 9.1% |
| Immigrants | Uganda | 43.4 /100 | #180 | Average 9.1% |
| Hmong | 40.2 /100 | #181 | Average 9.1% |
| Immigrants | Morocco | 40.2 /100 | #182 | Average 9.1% |
| Uruguayans | 39.2 /100 | #183 | Fair 9.1% |
| South American Indians | 38.7 /100 | #184 | Fair 9.1% |
| Immigrants | Saudi Arabia | 38.6 /100 | #185 | Fair 9.1% |
| Colombians | 36.1 /100 | #186 | Fair 9.2% |
| Delaware | 35.4 /100 | #187 | Fair 9.2% |
| Immigrants | Kenya | 34.0 /100 | #188 | Fair 9.2% |
Demographics Similar to Immigrants from Australia by Family Poverty
In terms of family poverty, the demographic groups most similar to Immigrants from Australia are Slovene (7.5%, a difference of 0.30%), Carpatho Rusyn (7.5%, a difference of 0.34%), Bolivian (7.5%, a difference of 0.40%), Scandinavian (7.6%, a difference of 0.63%), and Estonian (7.5%, a difference of 0.64%).
| Demographics | Rating | Rank | Family Poverty |
| Russians | 99.5 /100 | #34 | Exceptional 7.5% |
| Greeks | 99.4 /100 | #35 | Exceptional 7.5% |
| Turks | 99.4 /100 | #36 | Exceptional 7.5% |
| Estonians | 99.4 /100 | #37 | Exceptional 7.5% |
| Bolivians | 99.3 /100 | #38 | Exceptional 7.5% |
| Carpatho Rusyns | 99.3 /100 | #39 | Exceptional 7.5% |
| Slovenes | 99.3 /100 | #40 | Exceptional 7.5% |
| Immigrants | Australia | 99.2 /100 | #41 | Exceptional 7.6% |
| Scandinavians | 99.1 /100 | #42 | Exceptional 7.6% |
| Immigrants | Austria | 99.1 /100 | #43 | Exceptional 7.6% |
| Germans | 99.0 /100 | #44 | Exceptional 7.7% |
| Okinawans | 98.9 /100 | #45 | Exceptional 7.7% |
| Tongans | 98.9 /100 | #46 | Exceptional 7.7% |
| Immigrants | Czechoslovakia | 98.9 /100 | #47 | Exceptional 7.7% |
| Immigrants | Sri Lanka | 98.9 /100 | #48 | Exceptional 7.7% |