Afghan vs Immigrants from Barbados Median Male Earnings
COMPARE
Afghan
Immigrants from Barbados
Median Male Earnings
Median Male Earnings Comparison
Afghans
Immigrants from Barbados
$59,554
MEDIAN MALE EARNINGS
99.3/ 100
METRIC RATING
84th/ 347
METRIC RANK
$50,795
MEDIAN MALE EARNINGS
2.6/ 100
METRIC RATING
237th/ 347
METRIC RANK
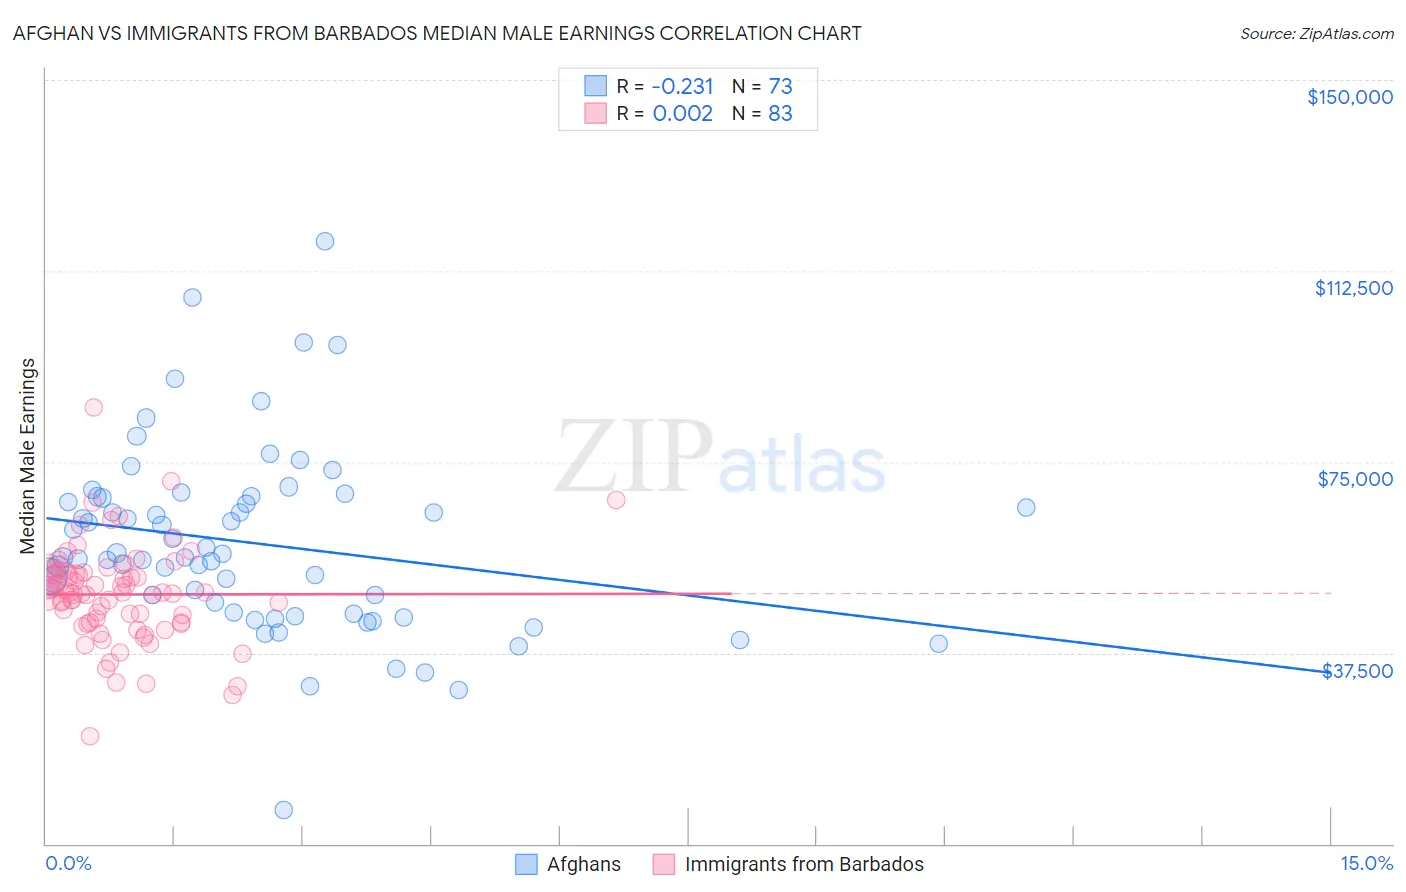
Afghan vs Immigrants from Barbados Median Male Earnings Correlation Chart
The statistical analysis conducted on geographies consisting of 148,869,100 people shows a weak negative correlation between the proportion of Afghans and median male earnings in the United States with a correlation coefficient (R) of -0.231 and weighted average of $59,554. Similarly, the statistical analysis conducted on geographies consisting of 112,696,118 people shows no correlation between the proportion of Immigrants from Barbados and median male earnings in the United States with a correlation coefficient (R) of 0.002 and weighted average of $50,795, a difference of 17.2%.
Median Male Earnings Correlation Summary
| Measurement | Afghan | Immigrants from Barbados |
| Minimum | $6,707 | $21,184 |
| Maximum | $118,365 | $85,682 |
| Range | $111,658 | $64,498 |
| Mean | $59,002 | $48,967 |
| Median | $56,261 | $49,260 |
| Interquartile 25% (IQ1) | $45,293 | $43,464 |
| Interquartile 75% (IQ3) | $68,035 | $53,363 |
| Interquartile Range (IQR) | $22,742 | $9,899 |
| Standard Deviation (Sample) | $18,269 | $9,605 |
| Standard Deviation (Population) | $18,144 | $9,547 |
Similar Demographics by Median Male Earnings
Demographics Similar to Afghans by Median Male Earnings
In terms of median male earnings, the demographic groups most similar to Afghans are Italian ($59,551, a difference of 0.0%), Immigrants from England ($59,527, a difference of 0.050%), Macedonian ($59,522, a difference of 0.050%), Immigrants from Argentina ($59,491, a difference of 0.11%), and Immigrants from Italy ($59,691, a difference of 0.23%).
| Demographics | Rating | Rank | Median Male Earnings |
| Paraguayans | 99.5 /100 | #77 | Exceptional $59,975 |
| Immigrants | Egypt | 99.5 /100 | #78 | Exceptional $59,925 |
| Immigrants | Ukraine | 99.5 /100 | #79 | Exceptional $59,820 |
| Immigrants | Hungary | 99.5 /100 | #80 | Exceptional $59,806 |
| Ukrainians | 99.4 /100 | #81 | Exceptional $59,728 |
| Croatians | 99.4 /100 | #82 | Exceptional $59,715 |
| Immigrants | Italy | 99.4 /100 | #83 | Exceptional $59,691 |
| Afghans | 99.3 /100 | #84 | Exceptional $59,554 |
| Italians | 99.3 /100 | #85 | Exceptional $59,551 |
| Immigrants | England | 99.3 /100 | #86 | Exceptional $59,527 |
| Macedonians | 99.3 /100 | #87 | Exceptional $59,522 |
| Immigrants | Argentina | 99.3 /100 | #88 | Exceptional $59,491 |
| Immigrants | Moldova | 99.2 /100 | #89 | Exceptional $59,417 |
| Austrians | 99.2 /100 | #90 | Exceptional $59,359 |
| Laotians | 99.2 /100 | #91 | Exceptional $59,351 |
Demographics Similar to Immigrants from Barbados by Median Male Earnings
In terms of median male earnings, the demographic groups most similar to Immigrants from Barbados are Malaysian ($50,772, a difference of 0.050%), American ($50,761, a difference of 0.070%), Pennsylvania German ($50,878, a difference of 0.16%), West Indian ($50,682, a difference of 0.22%), and Immigrants from St. Vincent and the Grenadines ($50,665, a difference of 0.26%).
| Demographics | Rating | Rank | Median Male Earnings |
| Immigrants | Nigeria | 4.2 /100 | #230 | Tragic $51,310 |
| Barbadians | 3.9 /100 | #231 | Tragic $51,236 |
| Sudanese | 3.9 /100 | #232 | Tragic $51,216 |
| Aleuts | 3.7 /100 | #233 | Tragic $51,168 |
| Cape Verdeans | 3.5 /100 | #234 | Tragic $51,103 |
| Immigrants | Western Africa | 3.0 /100 | #235 | Tragic $50,940 |
| Pennsylvania Germans | 2.8 /100 | #236 | Tragic $50,878 |
| Immigrants | Barbados | 2.6 /100 | #237 | Tragic $50,795 |
| Malaysians | 2.5 /100 | #238 | Tragic $50,772 |
| Americans | 2.5 /100 | #239 | Tragic $50,761 |
| West Indians | 2.3 /100 | #240 | Tragic $50,682 |
| Immigrants | St. Vincent and the Grenadines | 2.3 /100 | #241 | Tragic $50,665 |
| Guyanese | 2.2 /100 | #242 | Tragic $50,613 |
| French American Indians | 2.2 /100 | #243 | Tragic $50,611 |
| Houma | 2.0 /100 | #244 | Tragic $50,547 |