Immigrants from Canada vs Immigrants from Barbados Median Male Earnings
COMPARE
Immigrants from Canada
Immigrants from Barbados
Median Male Earnings
Median Male Earnings Comparison
Immigrants from Canada
Immigrants from Barbados
$60,388
MEDIAN MALE EARNINGS
99.7/ 100
METRIC RATING
69th/ 347
METRIC RANK
$50,795
MEDIAN MALE EARNINGS
2.6/ 100
METRIC RATING
237th/ 347
METRIC RANK
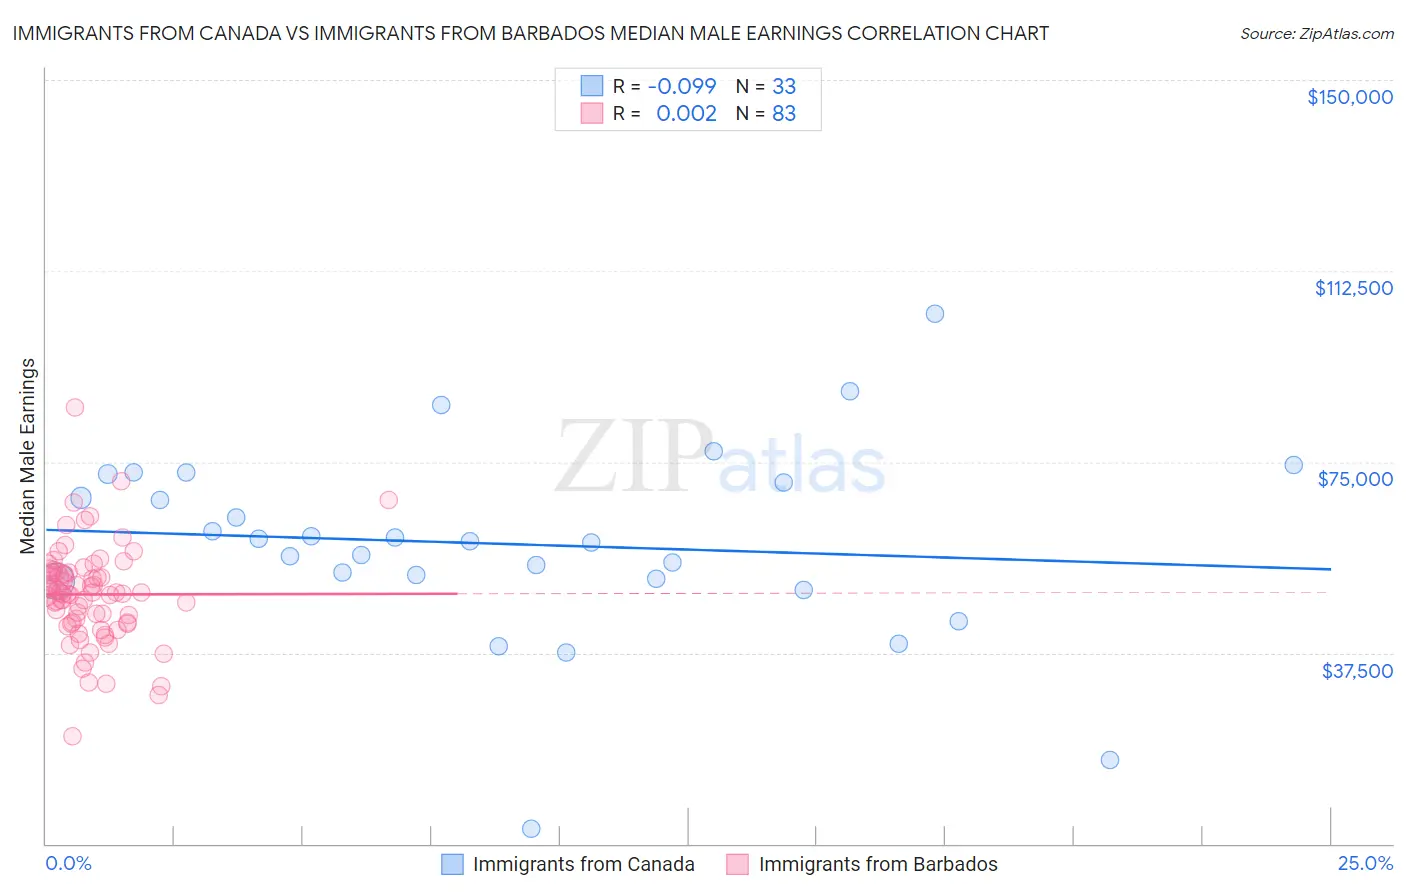
Immigrants from Canada vs Immigrants from Barbados Median Male Earnings Correlation Chart
The statistical analysis conducted on geographies consisting of 459,122,230 people shows a slight negative correlation between the proportion of Immigrants from Canada and median male earnings in the United States with a correlation coefficient (R) of -0.099 and weighted average of $60,388. Similarly, the statistical analysis conducted on geographies consisting of 112,696,118 people shows no correlation between the proportion of Immigrants from Barbados and median male earnings in the United States with a correlation coefficient (R) of 0.002 and weighted average of $50,795, a difference of 18.9%.
Median Male Earnings Correlation Summary
| Measurement | Immigrants from Canada | Immigrants from Barbados |
| Minimum | $2,875 | $21,184 |
| Maximum | $104,091 | $85,682 |
| Range | $101,216 | $64,498 |
| Mean | $58,839 | $48,967 |
| Median | $59,365 | $49,260 |
| Interquartile 25% (IQ1) | $51,760 | $43,464 |
| Interquartile 75% (IQ3) | $71,783 | $53,363 |
| Interquartile Range (IQR) | $20,022 | $9,899 |
| Standard Deviation (Sample) | $19,265 | $9,605 |
| Standard Deviation (Population) | $18,971 | $9,547 |
Similar Demographics by Median Male Earnings
Demographics Similar to Immigrants from Canada by Median Male Earnings
In terms of median male earnings, the demographic groups most similar to Immigrants from Canada are Immigrants from Bulgaria ($60,358, a difference of 0.050%), Mongolian ($60,350, a difference of 0.060%), Immigrants from Western Europe ($60,334, a difference of 0.090%), Immigrants from North America ($60,265, a difference of 0.20%), and Immigrants from Serbia ($60,600, a difference of 0.35%).
| Demographics | Rating | Rank | Median Male Earnings |
| Immigrants | Romania | 99.8 /100 | #62 | Exceptional $61,040 |
| Immigrants | Pakistan | 99.8 /100 | #63 | Exceptional $60,987 |
| Immigrants | Eastern Europe | 99.8 /100 | #64 | Exceptional $60,958 |
| Immigrants | Indonesia | 99.8 /100 | #65 | Exceptional $60,935 |
| Immigrants | Croatia | 99.8 /100 | #66 | Exceptional $60,914 |
| Immigrants | Spain | 99.8 /100 | #67 | Exceptional $60,750 |
| Immigrants | Serbia | 99.7 /100 | #68 | Exceptional $60,600 |
| Immigrants | Canada | 99.7 /100 | #69 | Exceptional $60,388 |
| Immigrants | Bulgaria | 99.7 /100 | #70 | Exceptional $60,358 |
| Mongolians | 99.7 /100 | #71 | Exceptional $60,350 |
| Immigrants | Western Europe | 99.7 /100 | #72 | Exceptional $60,334 |
| Immigrants | North America | 99.7 /100 | #73 | Exceptional $60,265 |
| Argentineans | 99.6 /100 | #74 | Exceptional $60,117 |
| Immigrants | Bolivia | 99.6 /100 | #75 | Exceptional $60,088 |
| Romanians | 99.6 /100 | #76 | Exceptional $60,063 |
Demographics Similar to Immigrants from Barbados by Median Male Earnings
In terms of median male earnings, the demographic groups most similar to Immigrants from Barbados are Malaysian ($50,772, a difference of 0.050%), American ($50,761, a difference of 0.070%), Pennsylvania German ($50,878, a difference of 0.16%), West Indian ($50,682, a difference of 0.22%), and Immigrants from St. Vincent and the Grenadines ($50,665, a difference of 0.26%).
| Demographics | Rating | Rank | Median Male Earnings |
| Immigrants | Nigeria | 4.2 /100 | #230 | Tragic $51,310 |
| Barbadians | 3.9 /100 | #231 | Tragic $51,236 |
| Sudanese | 3.9 /100 | #232 | Tragic $51,216 |
| Aleuts | 3.7 /100 | #233 | Tragic $51,168 |
| Cape Verdeans | 3.5 /100 | #234 | Tragic $51,103 |
| Immigrants | Western Africa | 3.0 /100 | #235 | Tragic $50,940 |
| Pennsylvania Germans | 2.8 /100 | #236 | Tragic $50,878 |
| Immigrants | Barbados | 2.6 /100 | #237 | Tragic $50,795 |
| Malaysians | 2.5 /100 | #238 | Tragic $50,772 |
| Americans | 2.5 /100 | #239 | Tragic $50,761 |
| West Indians | 2.3 /100 | #240 | Tragic $50,682 |
| Immigrants | St. Vincent and the Grenadines | 2.3 /100 | #241 | Tragic $50,665 |
| Guyanese | 2.2 /100 | #242 | Tragic $50,613 |
| French American Indians | 2.2 /100 | #243 | Tragic $50,611 |
| Houma | 2.0 /100 | #244 | Tragic $50,547 |