Ghanaian vs Immigrants from Dominica Wage/Income Gap
COMPARE
Ghanaian
Immigrants from Dominica
Wage/Income Gap
Wage/Income Gap Comparison
Ghanaians
Immigrants from Dominica
22.3%
WAGE/INCOME GAP
100.0/ 100
METRIC RATING
57th/ 347
METRIC RANK
20.0%
WAGE/INCOME GAP
100.0/ 100
METRIC RATING
19th/ 347
METRIC RANK
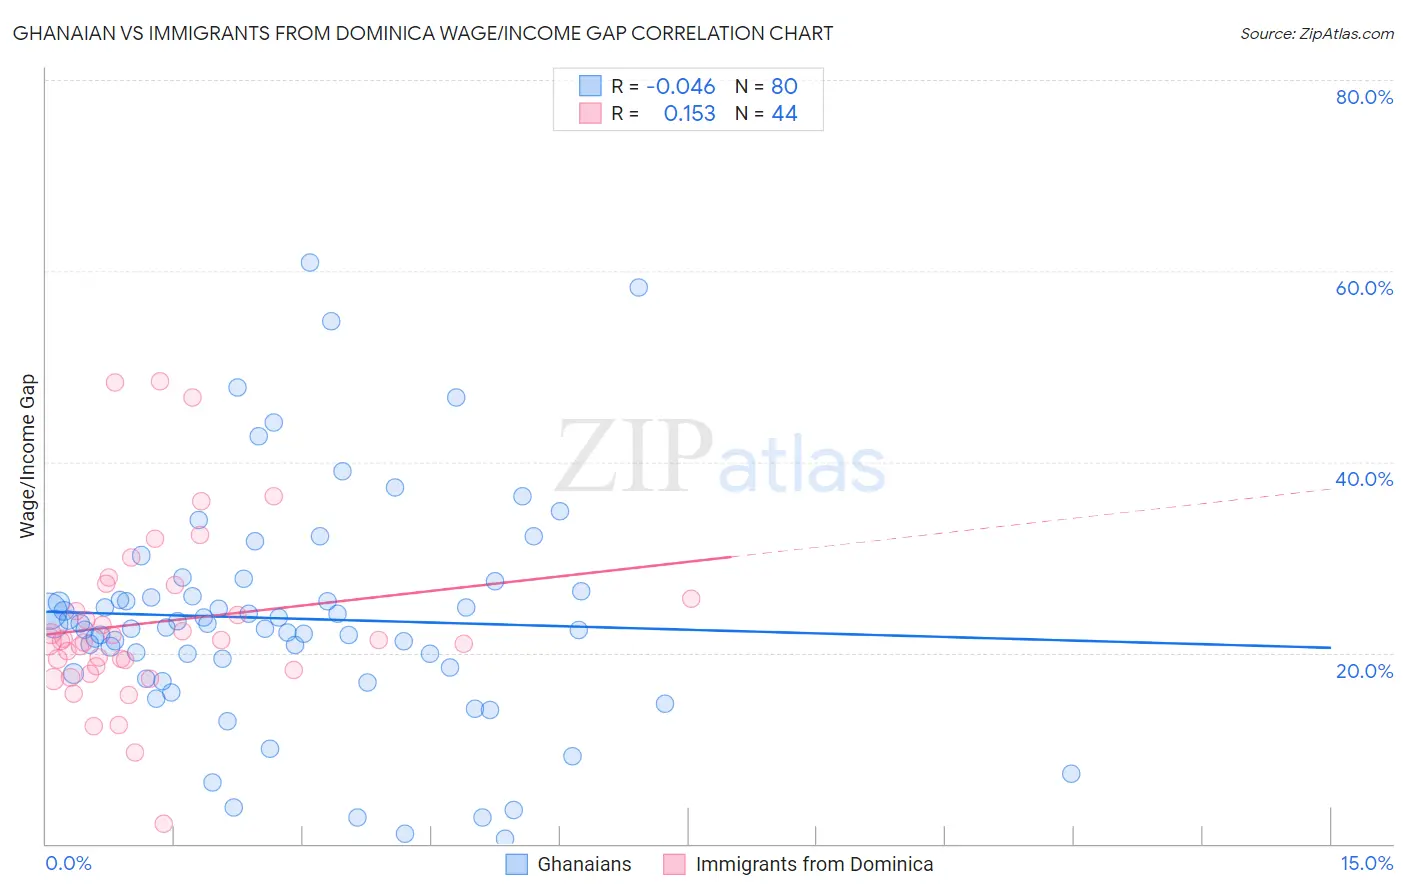
Ghanaian vs Immigrants from Dominica Wage/Income Gap Correlation Chart
The statistical analysis conducted on geographies consisting of 190,692,121 people shows no correlation between the proportion of Ghanaians and wage/income gap percentage in the United States with a correlation coefficient (R) of -0.046 and weighted average of 22.3%. Similarly, the statistical analysis conducted on geographies consisting of 83,787,019 people shows a poor positive correlation between the proportion of Immigrants from Dominica and wage/income gap percentage in the United States with a correlation coefficient (R) of 0.153 and weighted average of 20.0%, a difference of 11.5%.
Wage/Income Gap Correlation Summary
| Measurement | Ghanaian | Immigrants from Dominica |
| Minimum | 0.52% | 2.0% |
| Maximum | 60.8% | 48.5% |
| Range | 60.3% | 46.4% |
| Mean | 23.6% | 23.2% |
| Median | 22.8% | 21.3% |
| Interquartile 25% (IQ1) | 18.1% | 18.4% |
| Interquartile 75% (IQ3) | 26.2% | 26.4% |
| Interquartile Range (IQR) | 8.0% | 8.0% |
| Standard Deviation (Sample) | 11.9% | 9.3% |
| Standard Deviation (Population) | 11.8% | 9.2% |
Similar Demographics by Wage/Income Gap
Demographics Similar to Ghanaians by Wage/Income Gap
In terms of wage/income gap, the demographic groups most similar to Ghanaians are Immigrants from Cuba (22.4%, a difference of 0.080%), Immigrants from Ghana (22.3%, a difference of 0.10%), Navajo (22.4%, a difference of 0.12%), Immigrants from Zaire (22.3%, a difference of 0.13%), and Immigrants from Middle Africa (22.4%, a difference of 0.14%).
| Demographics | Rating | Rank | Wage/Income Gap |
| Immigrants | Western Africa | 100.0 /100 | #50 | Exceptional 22.0% |
| Tohono O'odham | 100.0 /100 | #51 | Exceptional 22.1% |
| Immigrants | Cameroon | 100.0 /100 | #52 | Exceptional 22.2% |
| Bangladeshis | 100.0 /100 | #53 | Exceptional 22.2% |
| Nepalese | 100.0 /100 | #54 | Exceptional 22.2% |
| Immigrants | Zaire | 100.0 /100 | #55 | Exceptional 22.3% |
| Immigrants | Ghana | 100.0 /100 | #56 | Exceptional 22.3% |
| Ghanaians | 100.0 /100 | #57 | Exceptional 22.3% |
| Immigrants | Cuba | 100.0 /100 | #58 | Exceptional 22.4% |
| Navajo | 100.0 /100 | #59 | Exceptional 22.4% |
| Immigrants | Middle Africa | 100.0 /100 | #60 | Exceptional 22.4% |
| Immigrants | Fiji | 100.0 /100 | #61 | Exceptional 22.4% |
| Immigrants | Guatemala | 100.0 /100 | #62 | Exceptional 22.5% |
| Immigrants | Ecuador | 100.0 /100 | #63 | Exceptional 22.5% |
| Spanish American Indians | 100.0 /100 | #64 | Exceptional 22.5% |
Demographics Similar to Immigrants from Dominica by Wage/Income Gap
In terms of wage/income gap, the demographic groups most similar to Immigrants from Dominica are Hopi (20.0%, a difference of 0.060%), Bahamian (20.2%, a difference of 1.1%), Haitian (19.7%, a difference of 1.4%), Immigrants from Caribbean (20.4%, a difference of 1.8%), and Jamaican (19.6%, a difference of 2.2%).
| Demographics | Rating | Rank | Wage/Income Gap |
| Immigrants | West Indies | 100.0 /100 | #12 | Exceptional 19.2% |
| Trinidadians and Tobagonians | 100.0 /100 | #13 | Exceptional 19.3% |
| Immigrants | Trinidad and Tobago | 100.0 /100 | #14 | Exceptional 19.3% |
| West Indians | 100.0 /100 | #15 | Exceptional 19.6% |
| Jamaicans | 100.0 /100 | #16 | Exceptional 19.6% |
| Haitians | 100.0 /100 | #17 | Exceptional 19.7% |
| Hopi | 100.0 /100 | #18 | Exceptional 20.0% |
| Immigrants | Dominica | 100.0 /100 | #19 | Exceptional 20.0% |
| Bahamians | 100.0 /100 | #20 | Exceptional 20.2% |
| Immigrants | Caribbean | 100.0 /100 | #21 | Exceptional 20.4% |
| Immigrants | Liberia | 100.0 /100 | #22 | Exceptional 20.6% |
| Immigrants | Dominican Republic | 100.0 /100 | #23 | Exceptional 20.6% |
| Dominicans | 100.0 /100 | #24 | Exceptional 20.6% |
| Senegalese | 100.0 /100 | #25 | Exceptional 20.7% |
| Pueblo | 100.0 /100 | #26 | Exceptional 20.7% |