Czech vs Egyptian Median Family Income
COMPARE
Czech
Egyptian
Median Family Income
Median Family Income Comparison
Czechs
Egyptians
$105,839
MEDIAN FAMILY INCOME
83.4/ 100
METRIC RATING
146th/ 347
METRIC RANK
$114,119
MEDIAN FAMILY INCOME
99.7/ 100
METRIC RATING
65th/ 347
METRIC RANK
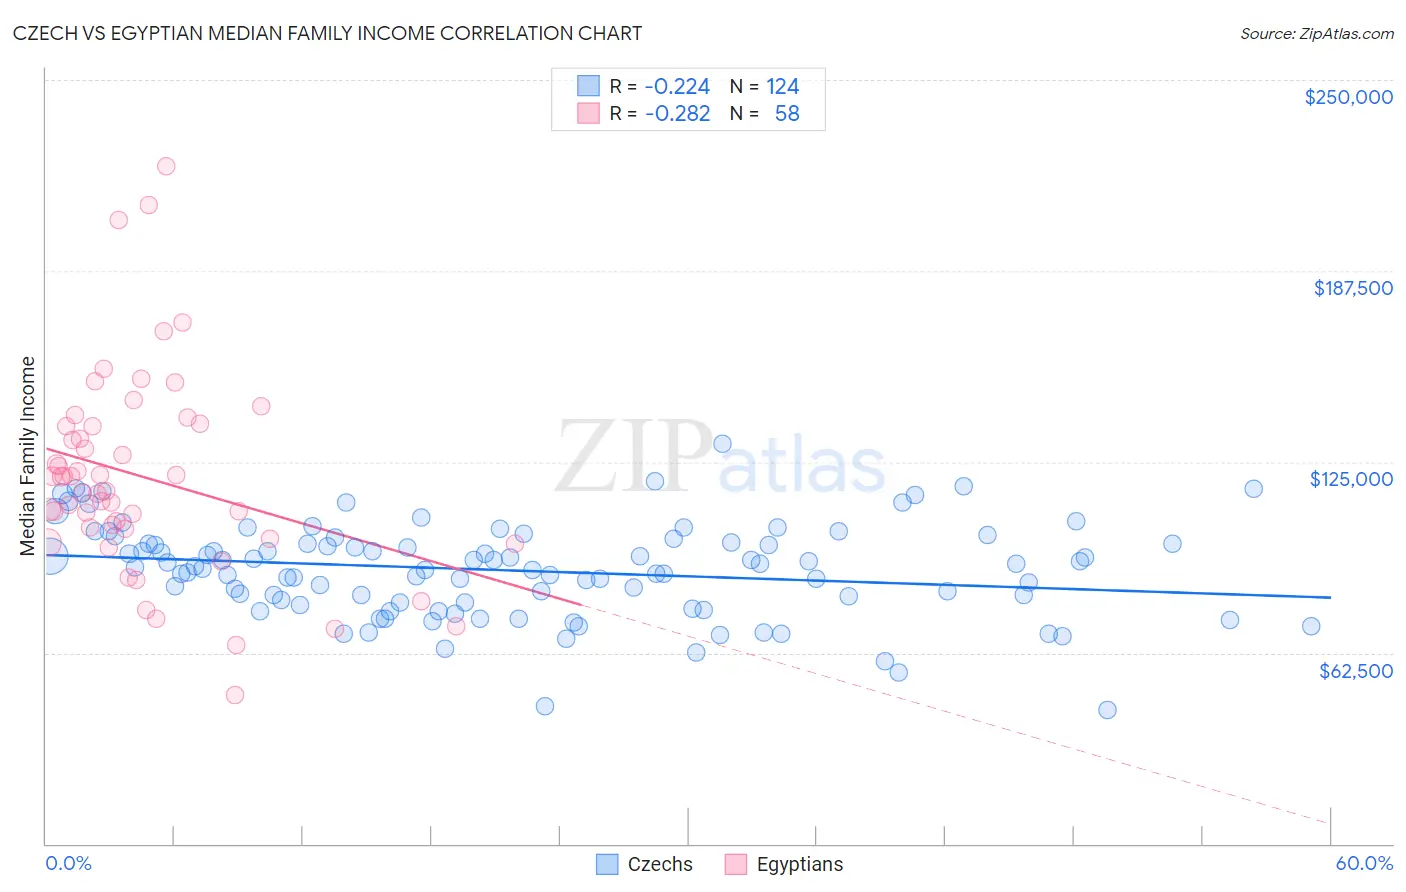
Czech vs Egyptian Median Family Income Correlation Chart
The statistical analysis conducted on geographies consisting of 484,215,939 people shows a weak negative correlation between the proportion of Czechs and median family income in the United States with a correlation coefficient (R) of -0.224 and weighted average of $105,839. Similarly, the statistical analysis conducted on geographies consisting of 276,687,434 people shows a weak negative correlation between the proportion of Egyptians and median family income in the United States with a correlation coefficient (R) of -0.282 and weighted average of $114,119, a difference of 7.8%.
Median Family Income Correlation Summary
| Measurement | Czech | Egyptian |
| Minimum | $43,750 | $48,661 |
| Maximum | $130,730 | $221,912 |
| Range | $86,980 | $173,251 |
| Mean | $89,458 | $119,991 |
| Median | $90,621 | $117,654 |
| Interquartile 25% (IQ1) | $79,002 | $103,125 |
| Interquartile 75% (IQ3) | $98,480 | $136,794 |
| Interquartile Range (IQR) | $19,478 | $33,669 |
| Standard Deviation (Sample) | $15,413 | $33,329 |
| Standard Deviation (Population) | $15,350 | $33,040 |
Similar Demographics by Median Family Income
Demographics Similar to Czechs by Median Family Income
In terms of median family income, the demographic groups most similar to Czechs are Danish ($105,900, a difference of 0.060%), Tongan ($105,967, a difference of 0.12%), Immigrants from Morocco ($105,964, a difference of 0.12%), Slovene ($106,020, a difference of 0.17%), and Immigrants from Chile ($105,655, a difference of 0.17%).
| Demographics | Rating | Rank | Median Family Income |
| Luxembourgers | 85.7 /100 | #139 | Excellent $106,183 |
| Norwegians | 85.5 /100 | #140 | Excellent $106,144 |
| Immigrants | Syria | 85.3 /100 | #141 | Excellent $106,118 |
| Slovenes | 84.7 /100 | #142 | Excellent $106,020 |
| Tongans | 84.3 /100 | #143 | Excellent $105,967 |
| Immigrants | Morocco | 84.3 /100 | #144 | Excellent $105,964 |
| Danes | 83.8 /100 | #145 | Excellent $105,900 |
| Czechs | 83.4 /100 | #146 | Excellent $105,839 |
| Immigrants | Chile | 82.1 /100 | #147 | Excellent $105,655 |
| Hungarians | 81.7 /100 | #148 | Excellent $105,609 |
| Immigrants | Germany | 80.9 /100 | #149 | Excellent $105,507 |
| Irish | 80.5 /100 | #150 | Excellent $105,453 |
| Peruvians | 80.4 /100 | #151 | Excellent $105,444 |
| Immigrants | Albania | 79.1 /100 | #152 | Good $105,285 |
| Slavs | 77.9 /100 | #153 | Good $105,144 |
Demographics Similar to Egyptians by Median Family Income
In terms of median family income, the demographic groups most similar to Egyptians are Paraguayan ($114,016, a difference of 0.090%), Immigrants from Scotland ($114,392, a difference of 0.24%), Immigrants from Pakistan ($114,406, a difference of 0.25%), Immigrants from Spain ($113,815, a difference of 0.27%), and Mongolian ($114,553, a difference of 0.38%).
| Demographics | Rating | Rank | Median Family Income |
| Immigrants | Indonesia | 99.8 /100 | #58 | Exceptional $115,162 |
| Immigrants | Netherlands | 99.8 /100 | #59 | Exceptional $114,987 |
| Immigrants | Latvia | 99.8 /100 | #60 | Exceptional $114,826 |
| Immigrants | Belarus | 99.8 /100 | #61 | Exceptional $114,586 |
| Mongolians | 99.8 /100 | #62 | Exceptional $114,553 |
| Immigrants | Pakistan | 99.8 /100 | #63 | Exceptional $114,406 |
| Immigrants | Scotland | 99.7 /100 | #64 | Exceptional $114,392 |
| Egyptians | 99.7 /100 | #65 | Exceptional $114,119 |
| Paraguayans | 99.7 /100 | #66 | Exceptional $114,016 |
| Immigrants | Spain | 99.7 /100 | #67 | Exceptional $113,815 |
| Immigrants | Serbia | 99.6 /100 | #68 | Exceptional $113,463 |
| Immigrants | Bulgaria | 99.6 /100 | #69 | Exceptional $113,461 |
| Immigrants | Romania | 99.6 /100 | #70 | Exceptional $113,434 |
| South Africans | 99.5 /100 | #71 | Exceptional $113,229 |
| Afghans | 99.5 /100 | #72 | Exceptional $112,971 |