Immigrants from Indonesia vs Egyptian Median Family Income
COMPARE
Immigrants from Indonesia
Egyptian
Median Family Income
Median Family Income Comparison
Immigrants from Indonesia
Egyptians
$115,162
MEDIAN FAMILY INCOME
99.8/ 100
METRIC RATING
58th/ 347
METRIC RANK
$114,119
MEDIAN FAMILY INCOME
99.7/ 100
METRIC RATING
65th/ 347
METRIC RANK
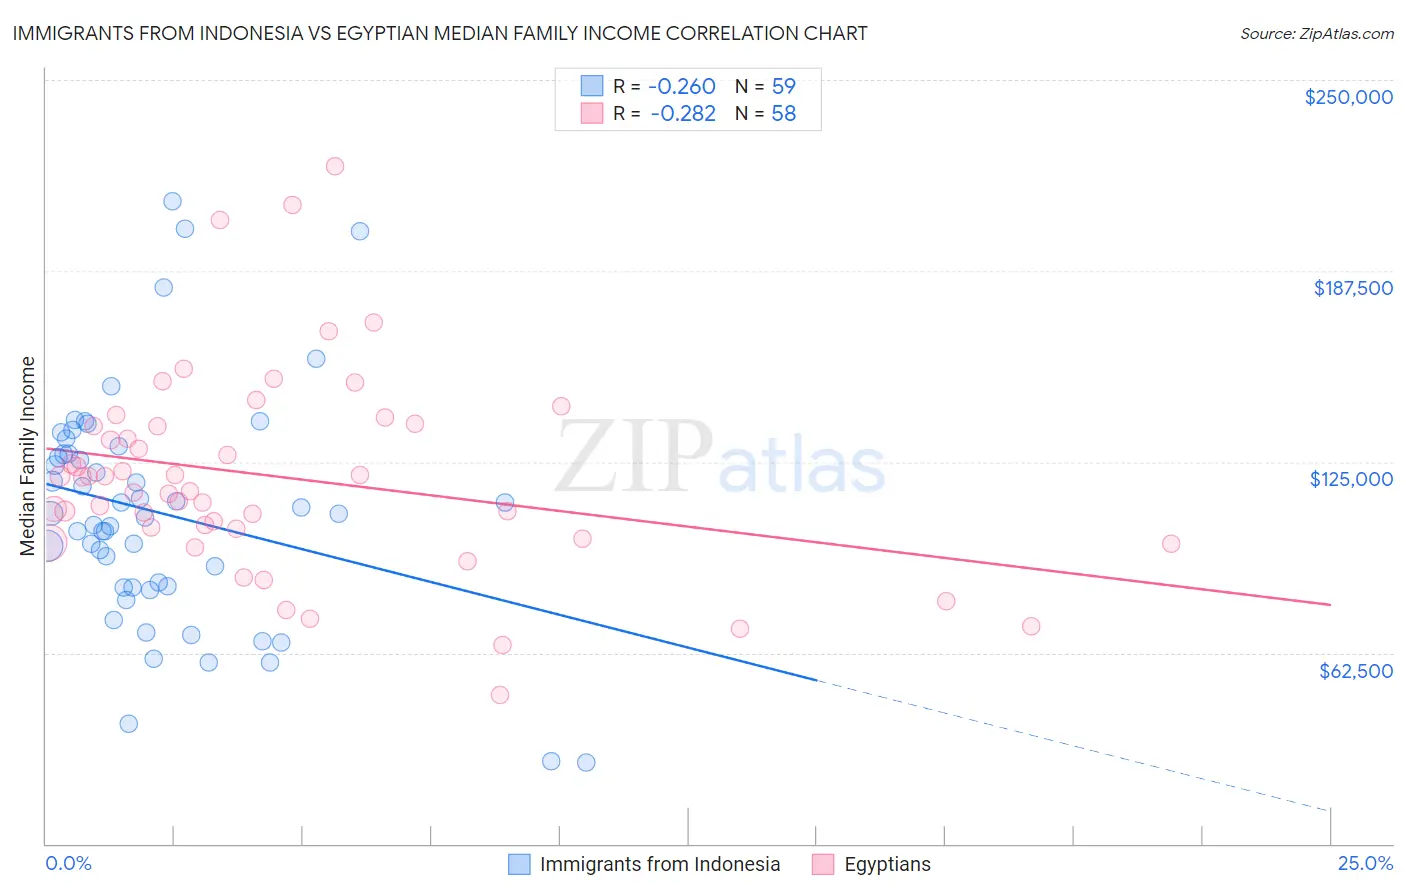
Immigrants from Indonesia vs Egyptian Median Family Income Correlation Chart
The statistical analysis conducted on geographies consisting of 215,683,063 people shows a weak negative correlation between the proportion of Immigrants from Indonesia and median family income in the United States with a correlation coefficient (R) of -0.260 and weighted average of $115,162. Similarly, the statistical analysis conducted on geographies consisting of 276,687,434 people shows a weak negative correlation between the proportion of Egyptians and median family income in the United States with a correlation coefficient (R) of -0.282 and weighted average of $114,119, a difference of 0.91%.
Median Family Income Correlation Summary
| Measurement | Immigrants from Indonesia | Egyptian |
| Minimum | $26,694 | $48,661 |
| Maximum | $210,375 | $221,912 |
| Range | $183,681 | $173,251 |
| Mean | $108,164 | $119,991 |
| Median | $108,113 | $117,654 |
| Interquartile 25% (IQ1) | $84,077 | $103,125 |
| Interquartile 75% (IQ3) | $127,666 | $136,794 |
| Interquartile Range (IQR) | $43,589 | $33,669 |
| Standard Deviation (Sample) | $37,920 | $33,329 |
| Standard Deviation (Population) | $37,598 | $33,040 |
Demographics Similar to Immigrants from Indonesia and Egyptians by Median Family Income
In terms of median family income, the demographic groups most similar to Immigrants from Indonesia are Greek ($115,192, a difference of 0.030%), New Zealander ($115,230, a difference of 0.060%), Immigrants from Netherlands ($114,987, a difference of 0.15%), Lithuanian ($115,395, a difference of 0.20%), and Immigrants from Latvia ($114,826, a difference of 0.29%). Similarly, the demographic groups most similar to Egyptians are Paraguayan ($114,016, a difference of 0.090%), Immigrants from Scotland ($114,392, a difference of 0.24%), Immigrants from Pakistan ($114,406, a difference of 0.25%), Immigrants from Spain ($113,815, a difference of 0.27%), and Mongolian ($114,553, a difference of 0.38%).
| Demographics | Rating | Rank | Median Family Income |
| Immigrants | Malaysia | 99.9 /100 | #51 | Exceptional $115,880 |
| Maltese | 99.9 /100 | #52 | Exceptional $115,862 |
| Immigrants | Norway | 99.9 /100 | #53 | Exceptional $115,847 |
| Immigrants | Europe | 99.9 /100 | #54 | Exceptional $115,523 |
| Lithuanians | 99.8 /100 | #55 | Exceptional $115,395 |
| New Zealanders | 99.8 /100 | #56 | Exceptional $115,230 |
| Greeks | 99.8 /100 | #57 | Exceptional $115,192 |
| Immigrants | Indonesia | 99.8 /100 | #58 | Exceptional $115,162 |
| Immigrants | Netherlands | 99.8 /100 | #59 | Exceptional $114,987 |
| Immigrants | Latvia | 99.8 /100 | #60 | Exceptional $114,826 |
| Immigrants | Belarus | 99.8 /100 | #61 | Exceptional $114,586 |
| Mongolians | 99.8 /100 | #62 | Exceptional $114,553 |
| Immigrants | Pakistan | 99.8 /100 | #63 | Exceptional $114,406 |
| Immigrants | Scotland | 99.7 /100 | #64 | Exceptional $114,392 |
| Egyptians | 99.7 /100 | #65 | Exceptional $114,119 |
| Paraguayans | 99.7 /100 | #66 | Exceptional $114,016 |
| Immigrants | Spain | 99.7 /100 | #67 | Exceptional $113,815 |
| Immigrants | Serbia | 99.6 /100 | #68 | Exceptional $113,463 |
| Immigrants | Bulgaria | 99.6 /100 | #69 | Exceptional $113,461 |
| Immigrants | Romania | 99.6 /100 | #70 | Exceptional $113,434 |
| South Africans | 99.5 /100 | #71 | Exceptional $113,229 |