Czech vs Vietnamese Median Family Income
COMPARE
Czech
Vietnamese
Median Family Income
Median Family Income Comparison
Czechs
Vietnamese
$105,839
MEDIAN FAMILY INCOME
83.4/ 100
METRIC RATING
146th/ 347
METRIC RANK
$96,123
MEDIAN FAMILY INCOME
3.4/ 100
METRIC RATING
225th/ 347
METRIC RANK
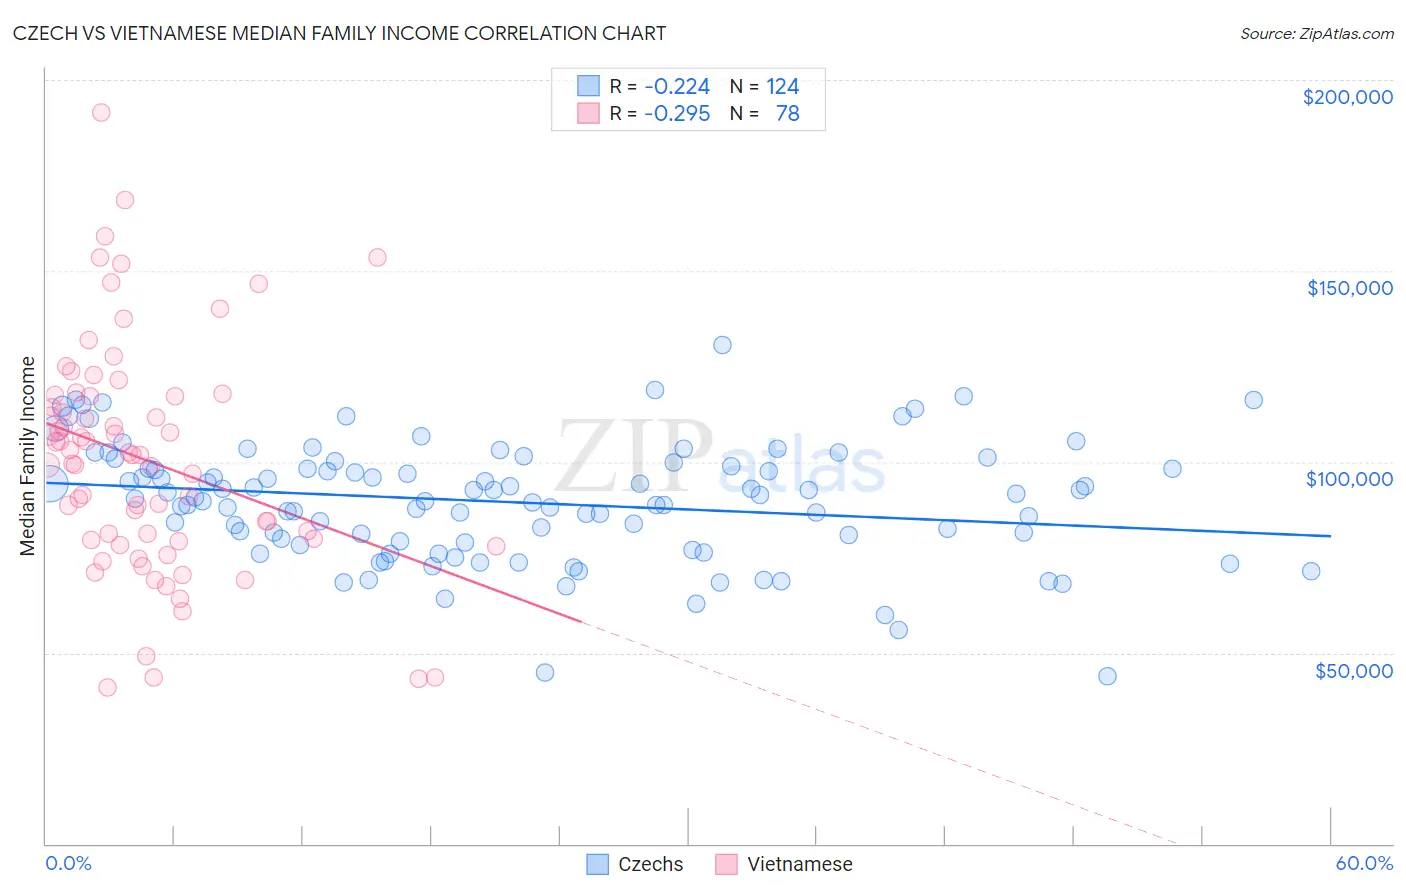
Czech vs Vietnamese Median Family Income Correlation Chart
The statistical analysis conducted on geographies consisting of 484,215,939 people shows a weak negative correlation between the proportion of Czechs and median family income in the United States with a correlation coefficient (R) of -0.224 and weighted average of $105,839. Similarly, the statistical analysis conducted on geographies consisting of 170,610,316 people shows a weak negative correlation between the proportion of Vietnamese and median family income in the United States with a correlation coefficient (R) of -0.295 and weighted average of $96,123, a difference of 10.1%.
Median Family Income Correlation Summary
| Measurement | Czech | Vietnamese |
| Minimum | $43,750 | $40,807 |
| Maximum | $130,730 | $191,643 |
| Range | $86,980 | $150,837 |
| Mean | $89,458 | $100,636 |
| Median | $90,621 | $101,824 |
| Interquartile 25% (IQ1) | $79,002 | $79,608 |
| Interquartile 75% (IQ3) | $98,480 | $117,250 |
| Interquartile Range (IQR) | $19,478 | $37,642 |
| Standard Deviation (Sample) | $15,413 | $30,077 |
| Standard Deviation (Population) | $15,350 | $29,884 |
Similar Demographics by Median Family Income
Demographics Similar to Czechs by Median Family Income
In terms of median family income, the demographic groups most similar to Czechs are Danish ($105,900, a difference of 0.060%), Tongan ($105,967, a difference of 0.12%), Immigrants from Morocco ($105,964, a difference of 0.12%), Slovene ($106,020, a difference of 0.17%), and Immigrants from Chile ($105,655, a difference of 0.17%).
| Demographics | Rating | Rank | Median Family Income |
| Luxembourgers | 85.7 /100 | #139 | Excellent $106,183 |
| Norwegians | 85.5 /100 | #140 | Excellent $106,144 |
| Immigrants | Syria | 85.3 /100 | #141 | Excellent $106,118 |
| Slovenes | 84.7 /100 | #142 | Excellent $106,020 |
| Tongans | 84.3 /100 | #143 | Excellent $105,967 |
| Immigrants | Morocco | 84.3 /100 | #144 | Excellent $105,964 |
| Danes | 83.8 /100 | #145 | Excellent $105,900 |
| Czechs | 83.4 /100 | #146 | Excellent $105,839 |
| Immigrants | Chile | 82.1 /100 | #147 | Excellent $105,655 |
| Hungarians | 81.7 /100 | #148 | Excellent $105,609 |
| Immigrants | Germany | 80.9 /100 | #149 | Excellent $105,507 |
| Irish | 80.5 /100 | #150 | Excellent $105,453 |
| Peruvians | 80.4 /100 | #151 | Excellent $105,444 |
| Immigrants | Albania | 79.1 /100 | #152 | Good $105,285 |
| Slavs | 77.9 /100 | #153 | Good $105,144 |
Demographics Similar to Vietnamese by Median Family Income
In terms of median family income, the demographic groups most similar to Vietnamese are Nonimmigrants ($96,231, a difference of 0.11%), Venezuelan ($96,281, a difference of 0.16%), Immigrants from Nigeria ($96,439, a difference of 0.33%), Immigrants from Ghana ($96,544, a difference of 0.44%), and Immigrants from Panama ($95,647, a difference of 0.50%).
| Demographics | Rating | Rank | Median Family Income |
| Immigrants | Cambodia | 5.8 /100 | #218 | Tragic $97,222 |
| Delaware | 5.1 /100 | #219 | Tragic $96,958 |
| Sudanese | 4.7 /100 | #220 | Tragic $96,783 |
| Immigrants | Ghana | 4.2 /100 | #221 | Tragic $96,544 |
| Immigrants | Nigeria | 4.0 /100 | #222 | Tragic $96,439 |
| Venezuelans | 3.7 /100 | #223 | Tragic $96,281 |
| Immigrants | Nonimmigrants | 3.6 /100 | #224 | Tragic $96,231 |
| Vietnamese | 3.4 /100 | #225 | Tragic $96,123 |
| Immigrants | Panama | 2.7 /100 | #226 | Tragic $95,647 |
| Alaska Natives | 2.6 /100 | #227 | Tragic $95,573 |
| Immigrants | Azores | 2.4 /100 | #228 | Tragic $95,402 |
| Marshallese | 2.2 /100 | #229 | Tragic $95,293 |
| Malaysians | 2.2 /100 | #230 | Tragic $95,230 |
| Ecuadorians | 2.1 /100 | #231 | Tragic $95,114 |
| Immigrants | Venezuela | 1.9 /100 | #232 | Tragic $94,904 |