Czech vs Alsatian Median Family Income
COMPARE
Czech
Alsatian
Median Family Income
Median Family Income Comparison
Czechs
Alsatians
$105,839
MEDIAN FAMILY INCOME
83.4/ 100
METRIC RATING
146th/ 347
METRIC RANK
$103,010
MEDIAN FAMILY INCOME
54.3/ 100
METRIC RATING
171st/ 347
METRIC RANK
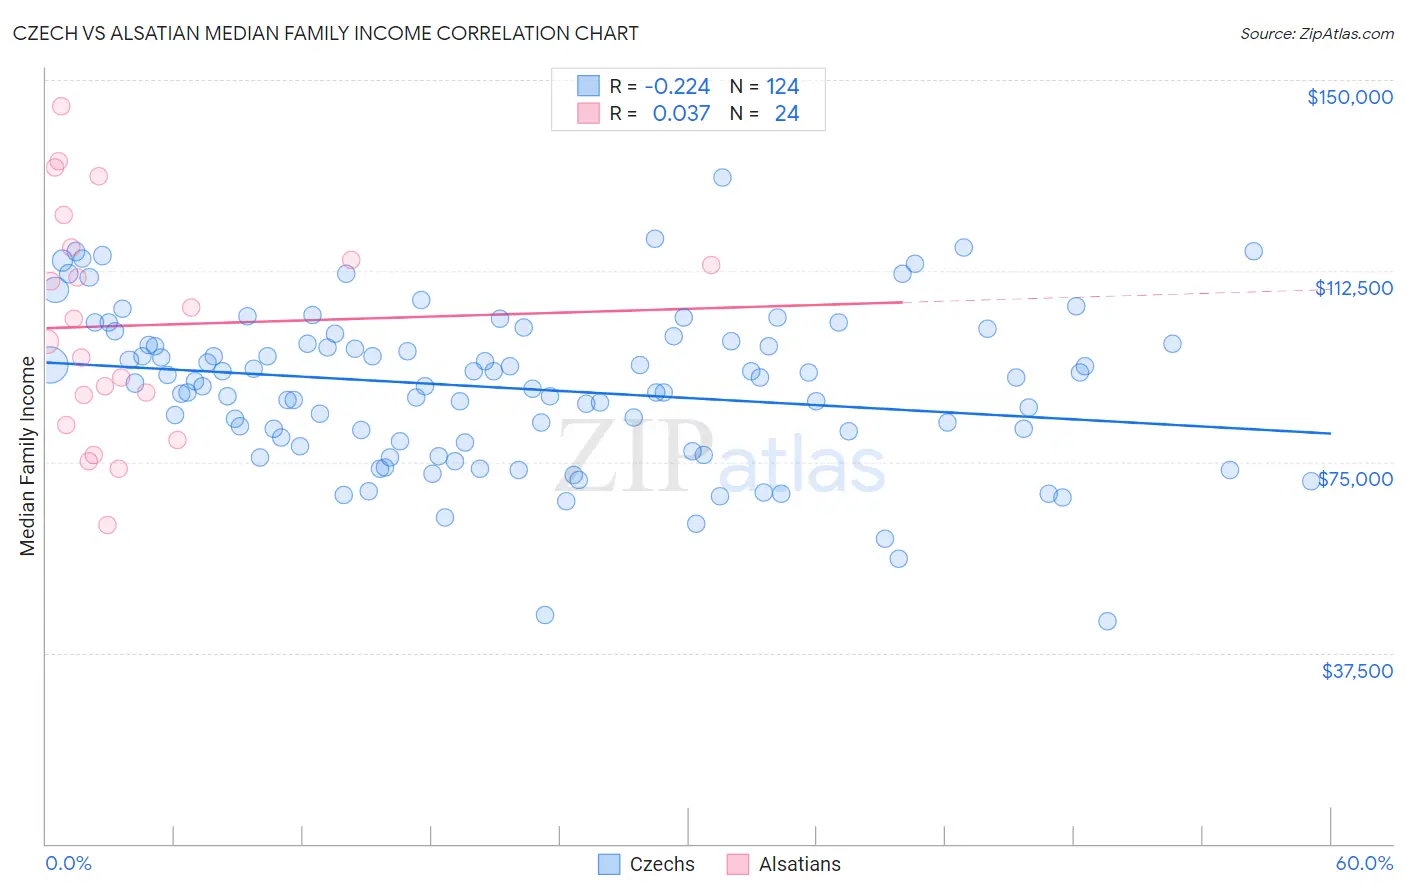
Czech vs Alsatian Median Family Income Correlation Chart
The statistical analysis conducted on geographies consisting of 484,215,939 people shows a weak negative correlation between the proportion of Czechs and median family income in the United States with a correlation coefficient (R) of -0.224 and weighted average of $105,839. Similarly, the statistical analysis conducted on geographies consisting of 82,676,924 people shows no correlation between the proportion of Alsatians and median family income in the United States with a correlation coefficient (R) of 0.037 and weighted average of $103,010, a difference of 2.8%.
Median Family Income Correlation Summary
| Measurement | Czech | Alsatian |
| Minimum | $43,750 | $62,500 |
| Maximum | $130,730 | $144,746 |
| Range | $86,980 | $82,246 |
| Mean | $89,458 | $101,763 |
| Median | $90,621 | $100,794 |
| Interquartile 25% (IQ1) | $79,002 | $85,164 |
| Interquartile 75% (IQ3) | $98,480 | $115,830 |
| Interquartile Range (IQR) | $19,478 | $30,667 |
| Standard Deviation (Sample) | $15,413 | $22,004 |
| Standard Deviation (Population) | $15,350 | $21,541 |
Similar Demographics by Median Family Income
Demographics Similar to Czechs by Median Family Income
In terms of median family income, the demographic groups most similar to Czechs are Danish ($105,900, a difference of 0.060%), Tongan ($105,967, a difference of 0.12%), Immigrants from Morocco ($105,964, a difference of 0.12%), Slovene ($106,020, a difference of 0.17%), and Immigrants from Chile ($105,655, a difference of 0.17%).
| Demographics | Rating | Rank | Median Family Income |
| Luxembourgers | 85.7 /100 | #139 | Excellent $106,183 |
| Norwegians | 85.5 /100 | #140 | Excellent $106,144 |
| Immigrants | Syria | 85.3 /100 | #141 | Excellent $106,118 |
| Slovenes | 84.7 /100 | #142 | Excellent $106,020 |
| Tongans | 84.3 /100 | #143 | Excellent $105,967 |
| Immigrants | Morocco | 84.3 /100 | #144 | Excellent $105,964 |
| Danes | 83.8 /100 | #145 | Excellent $105,900 |
| Czechs | 83.4 /100 | #146 | Excellent $105,839 |
| Immigrants | Chile | 82.1 /100 | #147 | Excellent $105,655 |
| Hungarians | 81.7 /100 | #148 | Excellent $105,609 |
| Immigrants | Germany | 80.9 /100 | #149 | Excellent $105,507 |
| Irish | 80.5 /100 | #150 | Excellent $105,453 |
| Peruvians | 80.4 /100 | #151 | Excellent $105,444 |
| Immigrants | Albania | 79.1 /100 | #152 | Good $105,285 |
| Slavs | 77.9 /100 | #153 | Good $105,144 |
Demographics Similar to Alsatians by Median Family Income
In terms of median family income, the demographic groups most similar to Alsatians are Immigrants from Uzbekistan ($103,197, a difference of 0.18%), Immigrants from Eritrea ($102,823, a difference of 0.18%), Belgian ($102,788, a difference of 0.22%), Czechoslovakian ($103,273, a difference of 0.26%), and Finnish ($102,676, a difference of 0.33%).
| Demographics | Rating | Rank | Median Family Income |
| Sierra Leoneans | 64.7 /100 | #164 | Good $103,859 |
| Slovaks | 63.1 /100 | #165 | Good $103,729 |
| English | 62.6 /100 | #166 | Good $103,684 |
| South American Indians | 61.9 /100 | #167 | Good $103,624 |
| Immigrants | Peru | 60.8 /100 | #168 | Good $103,534 |
| Czechoslovakians | 57.6 /100 | #169 | Average $103,273 |
| Immigrants | Uzbekistan | 56.6 /100 | #170 | Average $103,197 |
| Alsatians | 54.3 /100 | #171 | Average $103,010 |
| Immigrants | Eritrea | 51.9 /100 | #172 | Average $102,823 |
| Belgians | 51.4 /100 | #173 | Average $102,788 |
| Finns | 50.0 /100 | #174 | Average $102,676 |
| Immigrants | Eastern Africa | 47.1 /100 | #175 | Average $102,451 |
| French | 46.1 /100 | #176 | Average $102,368 |
| Germans | 44.6 /100 | #177 | Average $102,254 |
| Welsh | 43.3 /100 | #178 | Average $102,151 |