Czech vs Immigrants from China Median Family Income
COMPARE
Czech
Immigrants from China
Median Family Income
Median Family Income Comparison
Czechs
Immigrants from China
$105,839
MEDIAN FAMILY INCOME
83.4/ 100
METRIC RATING
146th/ 347
METRIC RANK
$125,540
MEDIAN FAMILY INCOME
100.0/ 100
METRIC RATING
16th/ 347
METRIC RANK
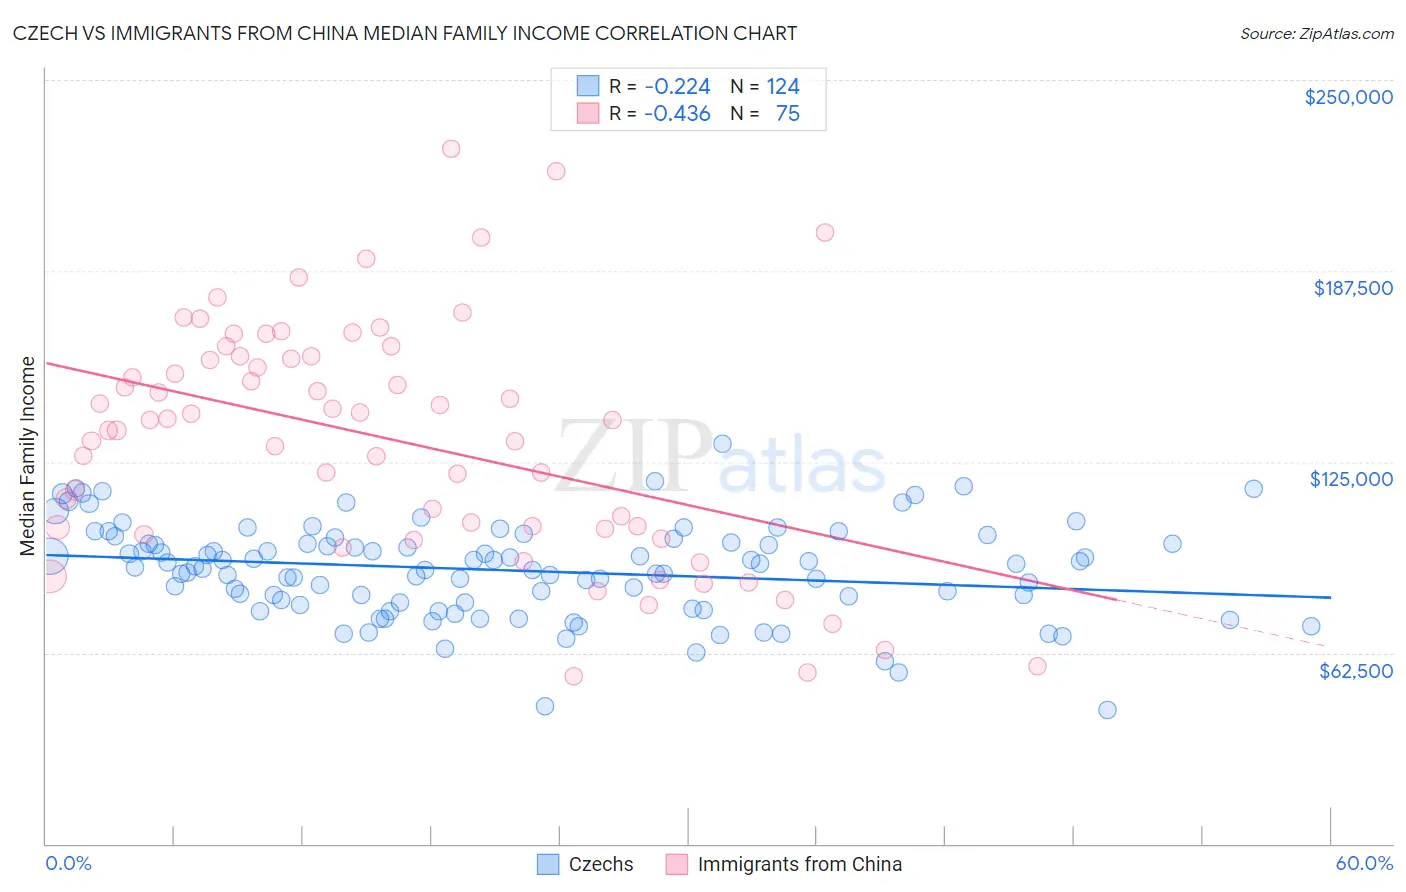
Czech vs Immigrants from China Median Family Income Correlation Chart
The statistical analysis conducted on geographies consisting of 484,215,939 people shows a weak negative correlation between the proportion of Czechs and median family income in the United States with a correlation coefficient (R) of -0.224 and weighted average of $105,839. Similarly, the statistical analysis conducted on geographies consisting of 456,354,343 people shows a moderate negative correlation between the proportion of Immigrants from China and median family income in the United States with a correlation coefficient (R) of -0.436 and weighted average of $125,540, a difference of 18.6%.
Median Family Income Correlation Summary
| Measurement | Czech | Immigrants from China |
| Minimum | $43,750 | $55,016 |
| Maximum | $130,730 | $227,676 |
| Range | $86,980 | $172,660 |
| Mean | $89,458 | $132,303 |
| Median | $90,621 | $138,661 |
| Interquartile 25% (IQ1) | $79,002 | $103,301 |
| Interquartile 75% (IQ3) | $98,480 | $159,432 |
| Interquartile Range (IQR) | $19,478 | $56,131 |
| Standard Deviation (Sample) | $15,413 | $38,553 |
| Standard Deviation (Population) | $15,350 | $38,295 |
Similar Demographics by Median Family Income
Demographics Similar to Czechs by Median Family Income
In terms of median family income, the demographic groups most similar to Czechs are Danish ($105,900, a difference of 0.060%), Tongan ($105,967, a difference of 0.12%), Immigrants from Morocco ($105,964, a difference of 0.12%), Slovene ($106,020, a difference of 0.17%), and Immigrants from Chile ($105,655, a difference of 0.17%).
| Demographics | Rating | Rank | Median Family Income |
| Luxembourgers | 85.7 /100 | #139 | Excellent $106,183 |
| Norwegians | 85.5 /100 | #140 | Excellent $106,144 |
| Immigrants | Syria | 85.3 /100 | #141 | Excellent $106,118 |
| Slovenes | 84.7 /100 | #142 | Excellent $106,020 |
| Tongans | 84.3 /100 | #143 | Excellent $105,967 |
| Immigrants | Morocco | 84.3 /100 | #144 | Excellent $105,964 |
| Danes | 83.8 /100 | #145 | Excellent $105,900 |
| Czechs | 83.4 /100 | #146 | Excellent $105,839 |
| Immigrants | Chile | 82.1 /100 | #147 | Excellent $105,655 |
| Hungarians | 81.7 /100 | #148 | Excellent $105,609 |
| Immigrants | Germany | 80.9 /100 | #149 | Excellent $105,507 |
| Irish | 80.5 /100 | #150 | Excellent $105,453 |
| Peruvians | 80.4 /100 | #151 | Excellent $105,444 |
| Immigrants | Albania | 79.1 /100 | #152 | Good $105,285 |
| Slavs | 77.9 /100 | #153 | Good $105,144 |
Demographics Similar to Immigrants from China by Median Family Income
In terms of median family income, the demographic groups most similar to Immigrants from China are Eastern European ($125,546, a difference of 0.0%), Indian (Asian) ($125,312, a difference of 0.18%), Immigrants from Eastern Asia ($125,150, a difference of 0.31%), Immigrants from South Central Asia ($125,956, a difference of 0.33%), and Immigrants from Australia ($126,620, a difference of 0.86%).
| Demographics | Rating | Rank | Median Family Income |
| Okinawans | 100.0 /100 | #9 | Exceptional $129,979 |
| Immigrants | Ireland | 100.0 /100 | #10 | Exceptional $127,584 |
| Immigrants | Israel | 100.0 /100 | #11 | Exceptional $127,430 |
| Cypriots | 100.0 /100 | #12 | Exceptional $127,064 |
| Immigrants | Australia | 100.0 /100 | #13 | Exceptional $126,620 |
| Immigrants | South Central Asia | 100.0 /100 | #14 | Exceptional $125,956 |
| Eastern Europeans | 100.0 /100 | #15 | Exceptional $125,546 |
| Immigrants | China | 100.0 /100 | #16 | Exceptional $125,540 |
| Indians (Asian) | 100.0 /100 | #17 | Exceptional $125,312 |
| Immigrants | Eastern Asia | 100.0 /100 | #18 | Exceptional $125,150 |
| Immigrants | Belgium | 100.0 /100 | #19 | Exceptional $123,831 |
| Burmese | 100.0 /100 | #20 | Exceptional $123,369 |
| Immigrants | Korea | 100.0 /100 | #21 | Exceptional $122,800 |
| Immigrants | Sweden | 100.0 /100 | #22 | Exceptional $122,765 |
| Immigrants | Japan | 100.0 /100 | #23 | Exceptional $122,764 |