Basque vs Alsatian Median Family Income
COMPARE
Basque
Alsatian
Median Family Income
Median Family Income Comparison
Basques
Alsatians
$104,760
MEDIAN FAMILY INCOME
74.4/ 100
METRIC RATING
156th/ 347
METRIC RANK
$103,010
MEDIAN FAMILY INCOME
54.3/ 100
METRIC RATING
171st/ 347
METRIC RANK
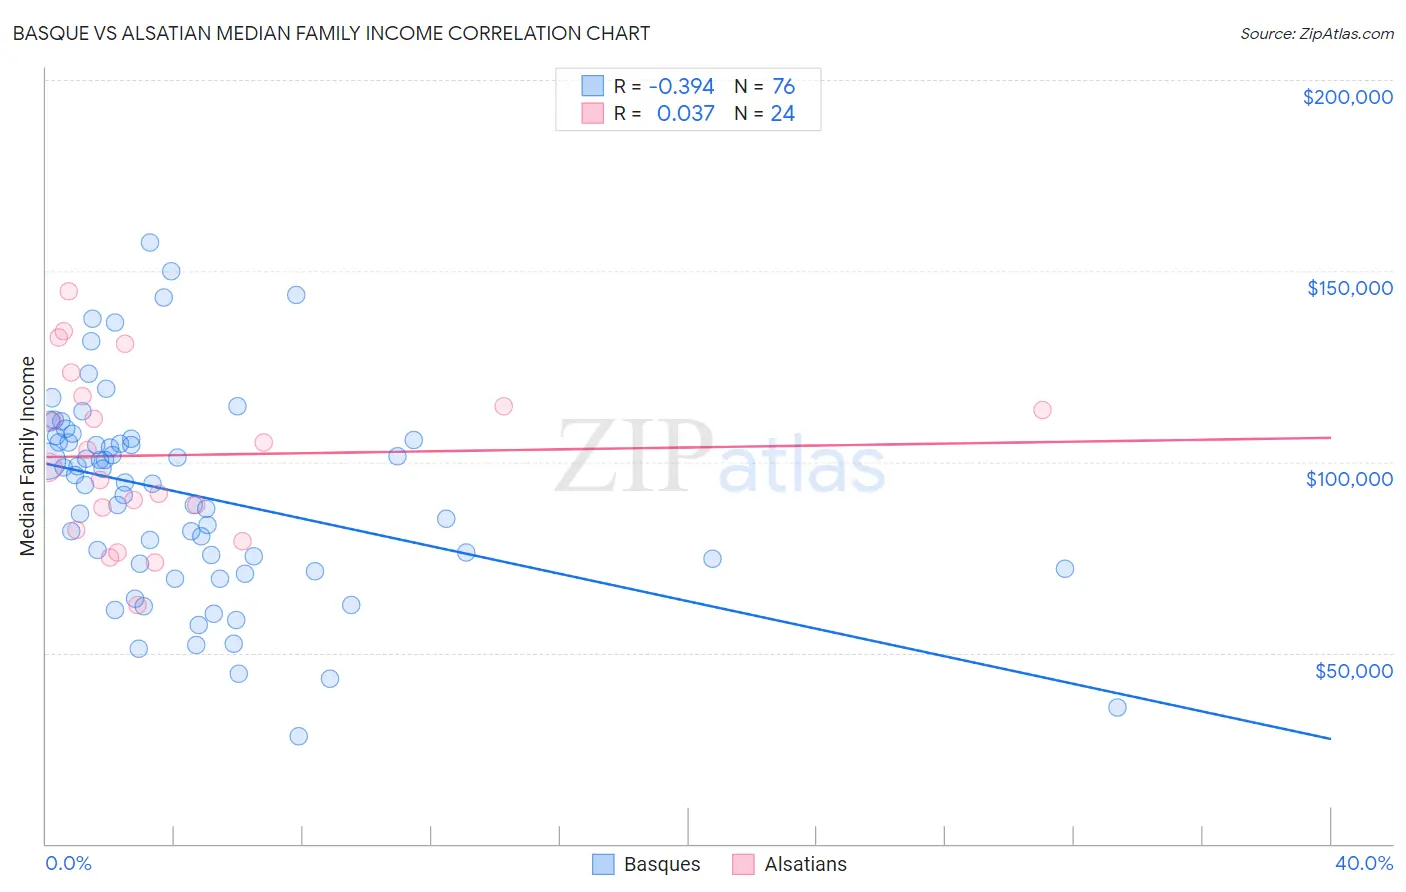
Basque vs Alsatian Median Family Income Correlation Chart
The statistical analysis conducted on geographies consisting of 165,742,125 people shows a mild negative correlation between the proportion of Basques and median family income in the United States with a correlation coefficient (R) of -0.394 and weighted average of $104,760. Similarly, the statistical analysis conducted on geographies consisting of 82,676,924 people shows no correlation between the proportion of Alsatians and median family income in the United States with a correlation coefficient (R) of 0.037 and weighted average of $103,010, a difference of 1.7%.
Median Family Income Correlation Summary
| Measurement | Basque | Alsatian |
| Minimum | $28,036 | $62,500 |
| Maximum | $157,351 | $144,746 |
| Range | $129,315 | $82,246 |
| Mean | $91,256 | $101,763 |
| Median | $94,457 | $100,794 |
| Interquartile 25% (IQ1) | $72,725 | $85,164 |
| Interquartile 75% (IQ3) | $105,919 | $115,830 |
| Interquartile Range (IQR) | $33,194 | $30,667 |
| Standard Deviation (Sample) | $26,783 | $22,004 |
| Standard Deviation (Population) | $26,606 | $21,541 |
Demographics Similar to Basques and Alsatians by Median Family Income
In terms of median family income, the demographic groups most similar to Basques are Native Hawaiian ($104,910, a difference of 0.14%), Immigrants from Nepal ($104,966, a difference of 0.20%), Moroccan ($104,488, a difference of 0.26%), Scandinavian ($104,410, a difference of 0.34%), and Swiss ($104,396, a difference of 0.35%). Similarly, the demographic groups most similar to Alsatians are Immigrants from Uzbekistan ($103,197, a difference of 0.18%), Immigrants from Eritrea ($102,823, a difference of 0.18%), Belgian ($102,788, a difference of 0.22%), Czechoslovakian ($103,273, a difference of 0.26%), and Immigrants from Peru ($103,534, a difference of 0.51%).
| Demographics | Rating | Rank | Median Family Income |
| Slavs | 77.9 /100 | #153 | Good $105,144 |
| Immigrants | Nepal | 76.3 /100 | #154 | Good $104,966 |
| Native Hawaiians | 75.8 /100 | #155 | Good $104,910 |
| Basques | 74.4 /100 | #156 | Good $104,760 |
| Moroccans | 71.6 /100 | #157 | Good $104,488 |
| Scandinavians | 70.8 /100 | #158 | Good $104,410 |
| Swiss | 70.7 /100 | #159 | Good $104,396 |
| Scottish | 69.5 /100 | #160 | Good $104,288 |
| Icelanders | 69.4 /100 | #161 | Good $104,282 |
| Immigrants | Sierra Leone | 66.2 /100 | #162 | Good $103,990 |
| Costa Ricans | 66.2 /100 | #163 | Good $103,989 |
| Sierra Leoneans | 64.7 /100 | #164 | Good $103,859 |
| Slovaks | 63.1 /100 | #165 | Good $103,729 |
| English | 62.6 /100 | #166 | Good $103,684 |
| South American Indians | 61.9 /100 | #167 | Good $103,624 |
| Immigrants | Peru | 60.8 /100 | #168 | Good $103,534 |
| Czechoslovakians | 57.6 /100 | #169 | Average $103,273 |
| Immigrants | Uzbekistan | 56.6 /100 | #170 | Average $103,197 |
| Alsatians | 54.3 /100 | #171 | Average $103,010 |
| Immigrants | Eritrea | 51.9 /100 | #172 | Average $102,823 |
| Belgians | 51.4 /100 | #173 | Average $102,788 |