Croatian vs Finnish Per Capita Income
COMPARE
Croatian
Finnish
Per Capita Income
Per Capita Income Comparison
Croatians
Finns
$47,742
PER CAPITA INCOME
99.0/ 100
METRIC RATING
88th/ 347
METRIC RANK
$43,461
PER CAPITA INCOME
44.4/ 100
METRIC RATING
179th/ 347
METRIC RANK
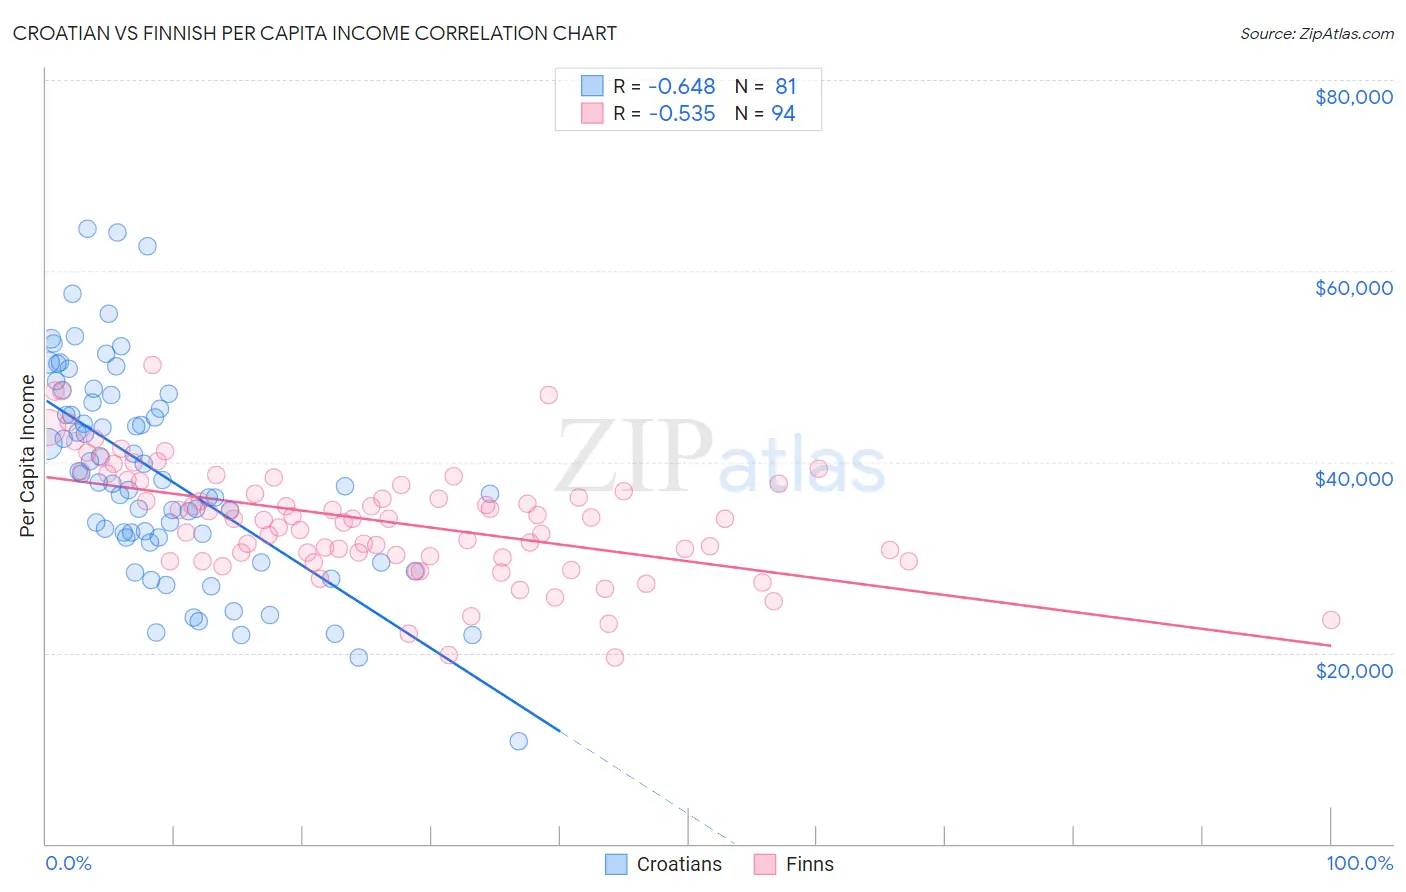
Croatian vs Finnish Per Capita Income Correlation Chart
The statistical analysis conducted on geographies consisting of 375,755,176 people shows a significant negative correlation between the proportion of Croatians and per capita income in the United States with a correlation coefficient (R) of -0.648 and weighted average of $47,742. Similarly, the statistical analysis conducted on geographies consisting of 404,694,586 people shows a substantial negative correlation between the proportion of Finns and per capita income in the United States with a correlation coefficient (R) of -0.535 and weighted average of $43,461, a difference of 9.9%.
Per Capita Income Correlation Summary
| Measurement | Croatian | Finnish |
| Minimum | $10,765 | $19,546 |
| Maximum | $64,427 | $50,135 |
| Range | $53,662 | $30,589 |
| Mean | $38,757 | $33,846 |
| Median | $37,830 | $34,020 |
| Interquartile 25% (IQ1) | $32,092 | $30,059 |
| Interquartile 75% (IQ3) | $46,598 | $37,749 |
| Interquartile Range (IQR) | $14,505 | $7,690 |
| Standard Deviation (Sample) | $10,847 | $5,978 |
| Standard Deviation (Population) | $10,780 | $5,946 |
Similar Demographics by Per Capita Income
Demographics Similar to Croatians by Per Capita Income
In terms of per capita income, the demographic groups most similar to Croatians are Northern European ($47,698, a difference of 0.090%), Italian ($47,574, a difference of 0.35%), Macedonian ($47,573, a difference of 0.36%), Immigrants from Moldova ($47,489, a difference of 0.53%), and Ukrainian ($48,014, a difference of 0.57%).
| Demographics | Rating | Rank | Per Capita Income |
| Armenians | 99.4 /100 | #81 | Exceptional $48,287 |
| Immigrants | Indonesia | 99.4 /100 | #82 | Exceptional $48,195 |
| Immigrants | Brazil | 99.4 /100 | #83 | Exceptional $48,164 |
| Immigrants | Ukraine | 99.3 /100 | #84 | Exceptional $48,134 |
| Austrians | 99.3 /100 | #85 | Exceptional $48,116 |
| Immigrants | Southern Europe | 99.3 /100 | #86 | Exceptional $48,027 |
| Ukrainians | 99.3 /100 | #87 | Exceptional $48,014 |
| Croatians | 99.0 /100 | #88 | Exceptional $47,742 |
| Northern Europeans | 98.9 /100 | #89 | Exceptional $47,698 |
| Italians | 98.8 /100 | #90 | Exceptional $47,574 |
| Macedonians | 98.8 /100 | #91 | Exceptional $47,573 |
| Immigrants | Moldova | 98.7 /100 | #92 | Exceptional $47,489 |
| Immigrants | Zimbabwe | 98.5 /100 | #93 | Exceptional $47,394 |
| Albanians | 98.5 /100 | #94 | Exceptional $47,379 |
| Immigrants | Egypt | 98.5 /100 | #95 | Exceptional $47,361 |
Demographics Similar to Finns by Per Capita Income
In terms of per capita income, the demographic groups most similar to Finns are Immigrants from Costa Rica ($43,464, a difference of 0.010%), Tlingit-Haida ($43,516, a difference of 0.13%), Sierra Leonean ($43,405, a difference of 0.13%), Immigrants from South Eastern Asia ($43,539, a difference of 0.18%), and Celtic ($43,621, a difference of 0.37%).
| Demographics | Rating | Rank | Per Capita Income |
| Czechoslovakians | 54.1 /100 | #172 | Average $43,806 |
| French | 50.7 /100 | #173 | Average $43,685 |
| Colombians | 50.0 /100 | #174 | Average $43,661 |
| Celtics | 48.9 /100 | #175 | Average $43,621 |
| Immigrants | South Eastern Asia | 46.6 /100 | #176 | Average $43,539 |
| Tlingit-Haida | 45.9 /100 | #177 | Average $43,516 |
| Immigrants | Costa Rica | 44.5 /100 | #178 | Average $43,464 |
| Finns | 44.4 /100 | #179 | Average $43,461 |
| Sierra Leoneans | 42.9 /100 | #180 | Average $43,405 |
| Welsh | 38.2 /100 | #181 | Fair $43,233 |
| Immigrants | Vietnam | 38.1 /100 | #182 | Fair $43,229 |
| Germans | 33.9 /100 | #183 | Fair $43,067 |
| Spaniards | 32.9 /100 | #184 | Fair $43,028 |
| Immigrants | Immigrants | 32.5 /100 | #185 | Fair $43,010 |
| French Canadians | 32.3 /100 | #186 | Fair $43,003 |