Panamanian vs Finnish Per Capita Income
COMPARE
Panamanian
Finnish
Per Capita Income
Per Capita Income Comparison
Panamanians
Finns
$42,035
PER CAPITA INCOME
13.9/ 100
METRIC RATING
208th/ 347
METRIC RANK
$43,461
PER CAPITA INCOME
44.4/ 100
METRIC RATING
179th/ 347
METRIC RANK
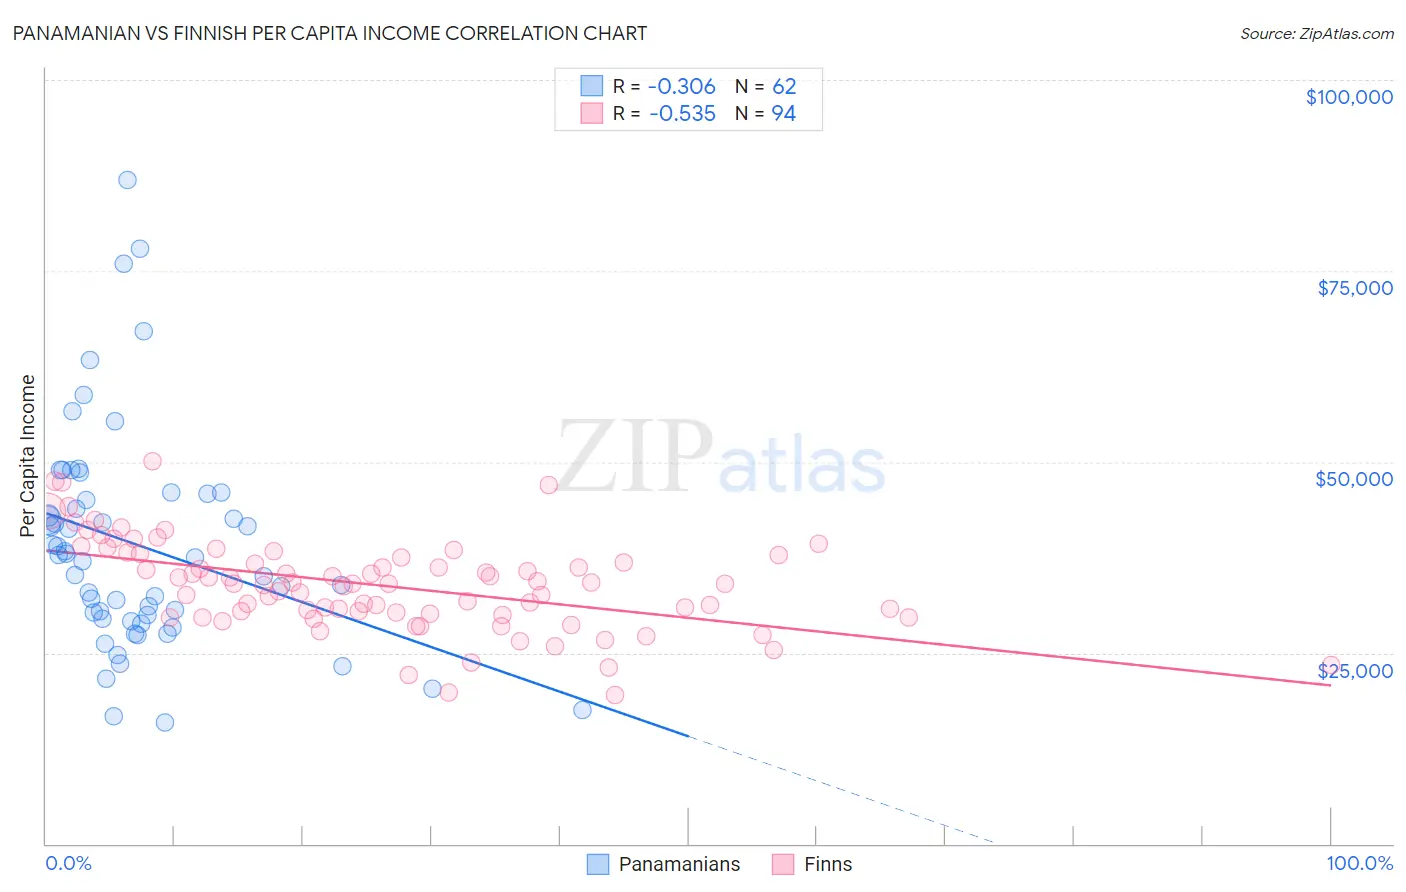
Panamanian vs Finnish Per Capita Income Correlation Chart
The statistical analysis conducted on geographies consisting of 281,258,630 people shows a mild negative correlation between the proportion of Panamanians and per capita income in the United States with a correlation coefficient (R) of -0.306 and weighted average of $42,035. Similarly, the statistical analysis conducted on geographies consisting of 404,694,586 people shows a substantial negative correlation between the proportion of Finns and per capita income in the United States with a correlation coefficient (R) of -0.535 and weighted average of $43,461, a difference of 3.4%.
Per Capita Income Correlation Summary
| Measurement | Panamanian | Finnish |
| Minimum | $15,844 | $19,546 |
| Maximum | $86,907 | $50,135 |
| Range | $71,063 | $30,589 |
| Mean | $39,085 | $33,846 |
| Median | $37,643 | $34,020 |
| Interquartile 25% (IQ1) | $29,415 | $30,059 |
| Interquartile 75% (IQ3) | $45,746 | $37,749 |
| Interquartile Range (IQR) | $16,331 | $7,690 |
| Standard Deviation (Sample) | $14,450 | $5,978 |
| Standard Deviation (Population) | $14,333 | $5,946 |
Similar Demographics by Per Capita Income
Demographics Similar to Panamanians by Per Capita Income
In terms of per capita income, the demographic groups most similar to Panamanians are Venezuelan ($42,074, a difference of 0.090%), Immigrants from Sudan ($41,986, a difference of 0.12%), Ecuadorian ($41,958, a difference of 0.18%), Ghanaian ($42,164, a difference of 0.31%), and White/Caucasian ($42,180, a difference of 0.35%).
| Demographics | Rating | Rank | Per Capita Income |
| Immigrants | Thailand | 17.6 /100 | #201 | Poor $42,289 |
| Immigrants | Bosnia and Herzegovina | 17.5 /100 | #202 | Poor $42,278 |
| Spanish | 17.0 /100 | #203 | Poor $42,249 |
| Aleuts | 16.4 /100 | #204 | Poor $42,210 |
| Whites/Caucasians | 15.9 /100 | #205 | Poor $42,180 |
| Ghanaians | 15.7 /100 | #206 | Poor $42,164 |
| Venezuelans | 14.4 /100 | #207 | Poor $42,074 |
| Panamanians | 13.9 /100 | #208 | Poor $42,035 |
| Immigrants | Sudan | 13.2 /100 | #209 | Poor $41,986 |
| Ecuadorians | 12.9 /100 | #210 | Poor $41,958 |
| Immigrants | Panama | 11.6 /100 | #211 | Poor $41,853 |
| Immigrants | Senegal | 11.3 /100 | #212 | Poor $41,830 |
| Immigrants | Venezuela | 10.2 /100 | #213 | Poor $41,727 |
| Immigrants | Bangladesh | 10.1 /100 | #214 | Poor $41,709 |
| Sudanese | 9.9 /100 | #215 | Tragic $41,695 |
Demographics Similar to Finns by Per Capita Income
In terms of per capita income, the demographic groups most similar to Finns are Immigrants from Costa Rica ($43,464, a difference of 0.010%), Tlingit-Haida ($43,516, a difference of 0.13%), Sierra Leonean ($43,405, a difference of 0.13%), Immigrants from South Eastern Asia ($43,539, a difference of 0.18%), and Celtic ($43,621, a difference of 0.37%).
| Demographics | Rating | Rank | Per Capita Income |
| Czechoslovakians | 54.1 /100 | #172 | Average $43,806 |
| French | 50.7 /100 | #173 | Average $43,685 |
| Colombians | 50.0 /100 | #174 | Average $43,661 |
| Celtics | 48.9 /100 | #175 | Average $43,621 |
| Immigrants | South Eastern Asia | 46.6 /100 | #176 | Average $43,539 |
| Tlingit-Haida | 45.9 /100 | #177 | Average $43,516 |
| Immigrants | Costa Rica | 44.5 /100 | #178 | Average $43,464 |
| Finns | 44.4 /100 | #179 | Average $43,461 |
| Sierra Leoneans | 42.9 /100 | #180 | Average $43,405 |
| Welsh | 38.2 /100 | #181 | Fair $43,233 |
| Immigrants | Vietnam | 38.1 /100 | #182 | Fair $43,229 |
| Germans | 33.9 /100 | #183 | Fair $43,067 |
| Spaniards | 32.9 /100 | #184 | Fair $43,028 |
| Immigrants | Immigrants | 32.5 /100 | #185 | Fair $43,010 |
| French Canadians | 32.3 /100 | #186 | Fair $43,003 |