Croatian vs Somali Per Capita Income

COMPARE

Croatian
Race
Ancestry
AfghanAfricanAlaska NativeAlaskan AthabascanAlbanianAleutAlsatianAmericanApacheArabArapahoArgentineanArmenianAssyrian/Chaldean/SyriacAustralianAustrianBahamianBangladeshiBarbadianBasqueBelgianBelizeanBermudanBhutaneseBlackfeetBolivianBrazilianBritishBritish West IndianBulgarianBurmeseCajunCambodianCanadianCape VerdeanCarpatho RusynCelticCentral AmericanCentral American IndianCherokeeCheyenneChickasawChileanChineseChippewaChoctawColombianColvilleComancheCosta RicanCreeCreekCroatianCrowCubanCypriotCzechCzechoslovakianDanishDelawareDominicanDutchDutch West IndianEastern EuropeanEcuadorianEgyptianEnglishEstonianEthiopianEuropeanFijianFilipinoFinnishFrenchFrench American IndianFrench CanadianGermanGerman RussianGhanaianGreekGuamanian/ChamorroGuatemalanGuyaneseHaitianHmongHonduranHopiHoumaHungarianIcelanderIndian (Asian)IndonesianInupiatIranianIraqiIrishIroquoisIsraeliItalianJamaicanJapaneseJordanianKenyanKiowaKoreanLaotianLatvianLebaneseLiberianLithuanianLumbeeLuxembourgerMacedonianMalaysianMalteseMarshalleseMenomineeMexicanMexican American IndianMongolianMoroccanNative HawaiianNavajoNepaleseNew ZealanderNicaraguanNigerianNorthern EuropeanNorwegianOkinawanOsageOttawaPaiutePakistaniPalestinianPanamanianParaguayanPennsylvania GermanPeruvianPimaPolishPortuguesePotawatomiPuebloPuerto RicanPuget Sound SalishRomanianRussianSalvadoranSamoanScandinavianScotch-IrishScottishSeminoleSenegaleseSerbianShoshoneSierra LeoneanSiouxSlavicSlovakSloveneSouth AfricanSouth AmericanSouth American IndianSoviet UnionSpaniardSpanishSpanish AmericanSpanish American IndianSri LankanSubsaharan AfricanSudaneseSwedishSwissSyrianTaiwaneseThaiTlingit-HaidaTohono O'OdhamTonganTrinidadian and TobagonianTsimshianTurkishU.S. Virgin IslanderUgandanUkrainianUruguayanUteVenezuelanVietnameseWelshWest IndianYakamaYaquiYugoslavianYumanYup'ikZimbabwean
Immigration
NonimmigrantsImmigrantsAfghanistanAfricaAlbaniaArgentinaArmeniaAsiaAustraliaAustriaBahamasBangladeshBarbadosBelarusBelgiumBelizeBoliviaBosnia and HerzegovinaBrazilBulgariaBurma/MyanmarCabo VerdeCambodiaCameroonCanadaCaribbeanCentral AmericaChileChinaColombiaCongoCosta RicaCroatiaCubaCzechoslovakiaDenmarkDominicaDominican RepublicEastern AfricaEastern AsiaEastern EuropeEcuadorEgyptEl SalvadorEnglandEritreaEthiopiaEuropeFijiFranceGermanyGhanaGreeceGrenadaGuatemalaGuyanaHaitiHondurasHong KongHungaryIndiaIndonesiaIranIraqIrelandIsraelItalyJamaicaJapanJordanKazakhstanKenyaKoreaKuwaitLaosLatin AmericaLatviaLebanonLiberiaLithuaniaMalaysiaMexicoMicronesiaMiddle AfricaMoldovaMoroccoNepalNetherlandsNicaraguaNigeriaNorth AmericaNorth MacedoniaNorthern AfricaNorthern EuropeNorwayOceaniaPakistanPanamaPeruPhilippinesPolandPortugalRomaniaRussiaSaudi ArabiaScotlandSenegalSerbiaSierra LeoneSingaporeSomaliaSouth AfricaSouth AmericaSouth Central AsiaSouth Eastern AsiaSouthern EuropeSpainSri LankaSt. Vincent and the GrenadinesSudanSwedenSwitzerlandSyriaTaiwanThailandTrinidad and TobagoTurkeyUgandaUkraineUruguayUzbekistanVenezuelaVietnamWest IndiesWestern AfricaWestern AsiaWestern EuropeYemenZaireZimbabweAzores
Somali
Race
Ancestry
AfghanAfricanAlaska NativeAlaskan AthabascanAlbanianAleutAlsatianAmericanApacheArabArapahoArgentineanArmenianAssyrian/Chaldean/SyriacAustralianAustrianBahamianBangladeshiBarbadianBasqueBelgianBelizeanBermudanBhutaneseBlackfeetBolivianBrazilianBritishBritish West IndianBulgarianBurmeseCajunCambodianCanadianCape VerdeanCarpatho RusynCelticCentral AmericanCentral American IndianCherokeeCheyenneChickasawChileanChineseChippewaChoctawColombianColvilleComancheCosta RicanCreeCreekCrowCubanCypriotCzechCzechoslovakianDanishDelawareDominicanDutchDutch West IndianEastern EuropeanEcuadorianEgyptianEnglishEstonianEthiopianEuropeanFijianFilipinoFinnishFrenchFrench American IndianFrench CanadianGermanGerman RussianGhanaianGreekGuamanian/ChamorroGuatemalanGuyaneseHaitianHmongHonduranHopiHoumaHungarianIcelanderIndian (Asian)IndonesianInupiatIranianIraqiIrishIroquoisIsraeliItalianJamaicanJapaneseJordanianKenyanKiowaKoreanLaotianLatvianLebaneseLiberianLithuanianLumbeeLuxembourgerMacedonianMalaysianMalteseMarshalleseMenomineeMexicanMexican American IndianMongolianMoroccanNative HawaiianNavajoNepaleseNew ZealanderNicaraguanNigerianNorthern EuropeanNorwegianOkinawanOsageOttawaPaiutePakistaniPalestinianPanamanianParaguayanPennsylvania GermanPeruvianPimaPolishPortuguesePotawatomiPuebloPuerto RicanPuget Sound SalishRomanianRussianSalvadoranSamoanScandinavianScotch-IrishScottishSeminoleSenegaleseSerbianShoshoneSierra LeoneanSiouxSlavicSlovakSloveneSomaliSouth AfricanSouth AmericanSouth American IndianSoviet UnionSpaniardSpanishSpanish AmericanSpanish American IndianSri LankanSubsaharan AfricanSudaneseSwedishSwissSyrianTaiwaneseThaiTlingit-HaidaTohono O'OdhamTonganTrinidadian and TobagonianTsimshianTurkishU.S. Virgin IslanderUgandanUkrainianUruguayanUteVenezuelanVietnameseWelshWest IndianYakamaYaquiYugoslavianYumanYup'ikZimbabwean
Immigration
NonimmigrantsImmigrantsAfghanistanAfricaAlbaniaArgentinaArmeniaAsiaAustraliaAustriaBahamasBangladeshBarbadosBelarusBelgiumBelizeBoliviaBosnia and HerzegovinaBrazilBulgariaBurma/MyanmarCabo VerdeCambodiaCameroonCanadaCaribbeanCentral AmericaChileChinaColombiaCongoCosta RicaCroatiaCubaCzechoslovakiaDenmarkDominicaDominican RepublicEastern AfricaEastern AsiaEastern EuropeEcuadorEgyptEl SalvadorEnglandEritreaEthiopiaEuropeFijiFranceGermanyGhanaGreeceGrenadaGuatemalaGuyanaHaitiHondurasHong KongHungaryIndiaIndonesiaIranIraqIrelandIsraelItalyJamaicaJapanJordanKazakhstanKenyaKoreaKuwaitLaosLatin AmericaLatviaLebanonLiberiaLithuaniaMalaysiaMexicoMicronesiaMiddle AfricaMoldovaMoroccoNepalNetherlandsNicaraguaNigeriaNorth AmericaNorth MacedoniaNorthern AfricaNorthern EuropeNorwayOceaniaPakistanPanamaPeruPhilippinesPolandPortugalRomaniaRussiaSaudi ArabiaScotlandSenegalSerbiaSierra LeoneSingaporeSomaliaSouth AfricaSouth AmericaSouth Central AsiaSouth Eastern AsiaSouthern EuropeSpainSri LankaSt. Vincent and the GrenadinesSudanSwedenSwitzerlandSyriaTaiwanThailandTrinidad and TobagoTurkeyUgandaUkraineUruguayUzbekistanVenezuelaVietnamWest IndiesWestern AfricaWestern AsiaWestern EuropeYemenZaireZimbabweAzores
Per Capita Income
Income
Poverty
Unemployment
Labor Participation
Family Structure
Vehicle Availability
Education Level
Disability

Per Capita Income Comparison

Croatians

Somalis

Exceptional
Tragic
$47,742
PER CAPITA INCOME
99.0/ 100
METRIC RATING
88th/ 347
METRIC RANK
$40,367
PER CAPITA INCOME
2.4/ 100
METRIC RATING
238th/ 347
METRIC RANK

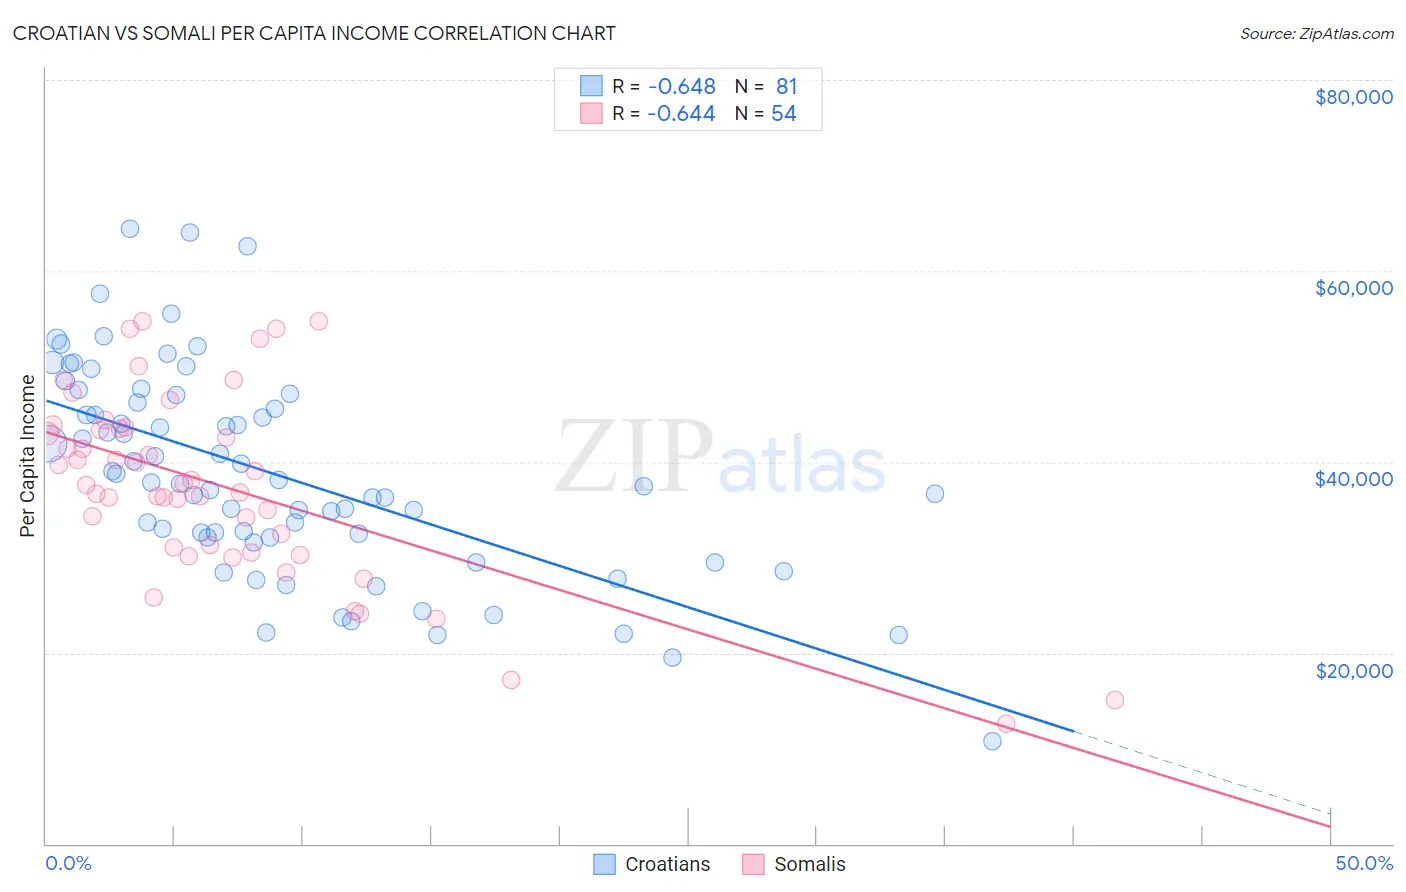
Croatian vs Somali Per Capita Income Correlation Chart

The statistical analysis conducted on geographies consisting of 375,755,176 people shows a significant negative correlation between the proportion of Croatians and per capita income in the United States with a correlation coefficient (R) of -0.648 and weighted average of $47,742. Similarly, the statistical analysis conducted on geographies consisting of 99,334,522 people shows a significant negative correlation between the proportion of Somalis and per capita income in the United States with a correlation coefficient (R) of -0.644 and weighted average of $40,367, a difference of 18.3%.
Croatian vs Somali Per Capita Income

Per Capita Income Correlation Summary

MeasurementCroatianSomali
Minimum$10,765$12,576
Maximum$64,427$54,740
Range$53,662$42,164
Mean$38,757$37,481
Median$37,830$37,654
Interquartile 25% (IQ1)$32,092$31,050
Interquartile 75% (IQ3)$46,598$43,455
Interquartile Range (IQR)$14,505$12,404
Standard Deviation (Sample)$10,847$9,737
Standard Deviation (Population)$10,780$9,647

Similar Demographics by Per Capita Income

Demographics Similar to Croatians by Per Capita Income

In terms of per capita income, the demographic groups most similar to Croatians are Northern European ($47,698, a difference of 0.090%), Italian ($47,574, a difference of 0.35%), Macedonian ($47,573, a difference of 0.36%), Immigrants from Moldova ($47,489, a difference of 0.53%), and Ukrainian ($48,014, a difference of 0.57%).
DemographicsRating | RankPer Capita Income
Armenians
99.4
/100
|
#81
Exceptional
$48,287
Immigrants | Indonesia
99.4
/100
|
#82
Exceptional
$48,195
Immigrants | Brazil
99.4
/100
|
#83
Exceptional
$48,164
Immigrants | Ukraine
99.3
/100
|
#84
Exceptional
$48,134
Austrians
99.3
/100
|
#85
Exceptional
$48,116
Immigrants | Southern Europe
99.3
/100
|
#86
Exceptional
$48,027
Ukrainians
99.3
/100
|
#87
Exceptional
$48,014
Croatians
99.0
/100
|
#88
Exceptional
$47,742
Northern Europeans
98.9
/100
|
#89
Exceptional
$47,698
Italians
98.8
/100
|
#90
Exceptional
$47,574
Macedonians
98.8
/100
|
#91
Exceptional
$47,573
Immigrants | Moldova
98.7
/100
|
#92
Exceptional
$47,489
Immigrants | Zimbabwe
98.5
/100
|
#93
Exceptional
$47,394
Albanians
98.5
/100
|
#94
Exceptional
$47,379
Immigrants | Egypt
98.5
/100
|
#95
Exceptional
$47,361

Demographics Similar to Somalis by Per Capita Income

In terms of per capita income, the demographic groups most similar to Somalis are Tsimshian ($40,344, a difference of 0.060%), Immigrants from Nigeria ($40,339, a difference of 0.070%), British West Indian ($40,330, a difference of 0.090%), Immigrants from Cambodia ($40,434, a difference of 0.16%), and Immigrants from Western Africa ($40,294, a difference of 0.18%).
DemographicsRating | RankPer Capita Income
Senegalese
4.8
/100
|
#231
Tragic
$41,000
Guyanese
4.5
/100
|
#232
Tragic
$40,949
Delaware
3.8
/100
|
#233
Tragic
$40,778
Immigrants | West Indies
3.7
/100
|
#234
Tragic
$40,763
Immigrants | Guyana
3.6
/100
|
#235
Tragic
$40,742
Immigrants | Nonimmigrants
3.4
/100
|
#236
Tragic
$40,669
Immigrants | Cambodia
2.6
/100
|
#237
Tragic
$40,434
Somalis
2.4
/100
|
#238
Tragic
$40,367
Tsimshian
2.4
/100
|
#239
Tragic
$40,344
Immigrants | Nigeria
2.3
/100
|
#240
Tragic
$40,339
British West Indians
2.3
/100
|
#241
Tragic
$40,330
Immigrants | Western Africa
2.2
/100
|
#242
Tragic
$40,294
German Russians
2.2
/100
|
#243
Tragic
$40,266
French American Indians
2.1
/100
|
#244
Tragic
$40,244
Sub-Saharan Africans
1.9
/100
|
#245
Tragic
$40,152