Croatian vs Finnish Bachelor's Degree
COMPARE
Croatian
Finnish
Bachelor's Degree
Bachelor's Degree Comparison
Croatians
Finns
40.6%
BACHELOR'S DEGREE
95.5/ 100
METRIC RATING
118th/ 347
METRIC RANK
36.7%
BACHELOR'S DEGREE
22.2/ 100
METRIC RATING
205th/ 347
METRIC RANK
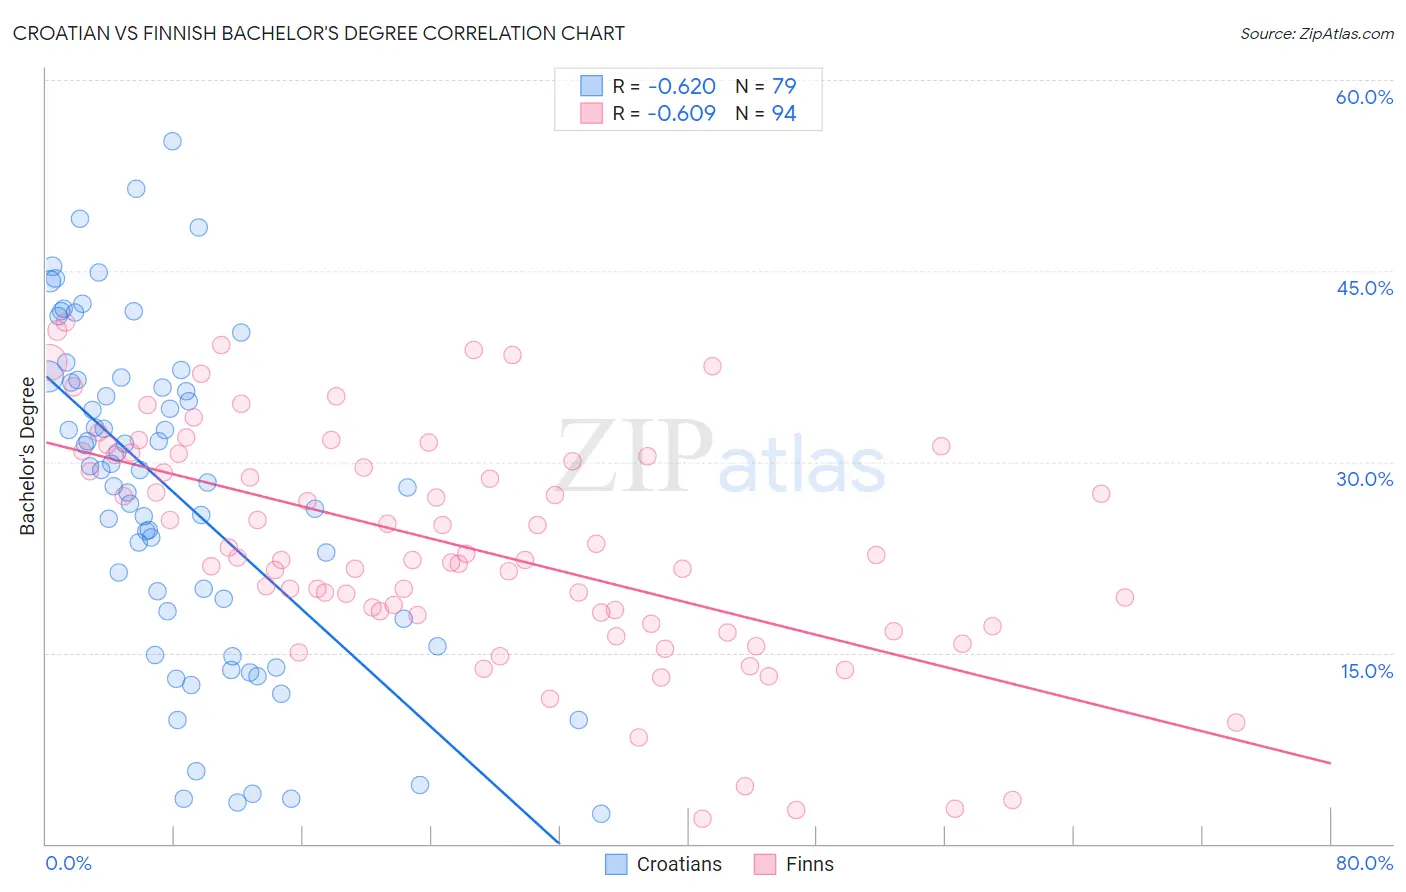
Croatian vs Finnish Bachelor's Degree Correlation Chart
The statistical analysis conducted on geographies consisting of 375,700,831 people shows a significant negative correlation between the proportion of Croatians and percentage of population with at least bachelor's degree education in the United States with a correlation coefficient (R) of -0.620 and weighted average of 40.6%. Similarly, the statistical analysis conducted on geographies consisting of 404,648,142 people shows a significant negative correlation between the proportion of Finns and percentage of population with at least bachelor's degree education in the United States with a correlation coefficient (R) of -0.609 and weighted average of 36.7%, a difference of 10.8%.
Bachelor's Degree Correlation Summary
| Measurement | Croatian | Finnish |
| Minimum | 2.3% | 2.0% |
| Maximum | 55.2% | 40.9% |
| Range | 52.9% | 38.9% |
| Mean | 27.5% | 23.4% |
| Median | 29.3% | 22.4% |
| Interquartile 25% (IQ1) | 17.6% | 18.0% |
| Interquartile 75% (IQ3) | 36.5% | 30.5% |
| Interquartile Range (IQR) | 18.8% | 12.6% |
| Standard Deviation (Sample) | 12.8% | 9.0% |
| Standard Deviation (Population) | 12.8% | 9.0% |
Similar Demographics by Bachelor's Degree
Demographics Similar to Croatians by Bachelor's Degree
In terms of bachelor's degree, the demographic groups most similar to Croatians are Austrian (40.6%, a difference of 0.020%), Immigrants from Uganda (40.7%, a difference of 0.12%), Palestinian (40.7%, a difference of 0.17%), Immigrants from Syria (40.5%, a difference of 0.32%), and Venezuelan (40.5%, a difference of 0.39%).
| Demographics | Rating | Rank | Bachelor's Degree |
| Immigrants | Chile | 96.4 /100 | #111 | Exceptional 40.8% |
| Ugandans | 96.3 /100 | #112 | Exceptional 40.8% |
| Brazilians | 96.3 /100 | #113 | Exceptional 40.8% |
| Afghans | 96.2 /100 | #114 | Exceptional 40.8% |
| Palestinians | 95.8 /100 | #115 | Exceptional 40.7% |
| Immigrants | Uganda | 95.7 /100 | #116 | Exceptional 40.7% |
| Austrians | 95.5 /100 | #117 | Exceptional 40.6% |
| Croatians | 95.5 /100 | #118 | Exceptional 40.6% |
| Immigrants | Syria | 94.9 /100 | #119 | Exceptional 40.5% |
| Venezuelans | 94.7 /100 | #120 | Exceptional 40.5% |
| Moroccans | 94.6 /100 | #121 | Exceptional 40.5% |
| Immigrants | Albania | 94.4 /100 | #122 | Exceptional 40.4% |
| Lebanese | 94.3 /100 | #123 | Exceptional 40.4% |
| Immigrants | Eritrea | 94.3 /100 | #124 | Exceptional 40.4% |
| British | 94.2 /100 | #125 | Exceptional 40.4% |
Demographics Similar to Finns by Bachelor's Degree
In terms of bachelor's degree, the demographic groups most similar to Finns are Immigrants (36.7%, a difference of 0.10%), Immigrants from Nigeria (36.7%, a difference of 0.14%), Spaniard (36.6%, a difference of 0.14%), Immigrants from Middle Africa (36.6%, a difference of 0.23%), and Immigrants from Zaire (36.8%, a difference of 0.43%).
| Demographics | Rating | Rank | Bachelor's Degree |
| Welsh | 29.1 /100 | #198 | Fair 37.0% |
| Immigrants | Costa Rica | 27.4 /100 | #199 | Fair 36.9% |
| Immigrants | Ghana | 27.4 /100 | #200 | Fair 36.9% |
| Immigrants | South Eastern Asia | 25.4 /100 | #201 | Fair 36.8% |
| Immigrants | Zaire | 25.3 /100 | #202 | Fair 36.8% |
| Immigrants | Nigeria | 23.1 /100 | #203 | Fair 36.7% |
| Immigrants | Immigrants | 22.8 /100 | #204 | Fair 36.7% |
| Finns | 22.2 /100 | #205 | Fair 36.7% |
| Spaniards | 21.2 /100 | #206 | Fair 36.6% |
| Immigrants | Middle Africa | 20.6 /100 | #207 | Fair 36.6% |
| Immigrants | Thailand | 19.4 /100 | #208 | Poor 36.5% |
| Panamanians | 18.8 /100 | #209 | Poor 36.5% |
| French | 18.6 /100 | #210 | Poor 36.5% |
| Scotch-Irish | 18.3 /100 | #211 | Poor 36.4% |
| Immigrants | Philippines | 17.8 /100 | #212 | Poor 36.4% |