Celtic vs Latvian Median Female Earnings
COMPARE
Celtic
Latvian
Median Female Earnings
Median Female Earnings Comparison
Celtics
Latvians
$38,283
MEDIAN FEMALE EARNINGS
5.0/ 100
METRIC RATING
234th/ 347
METRIC RANK
$43,941
MEDIAN FEMALE EARNINGS
100.0/ 100
METRIC RATING
38th/ 347
METRIC RANK
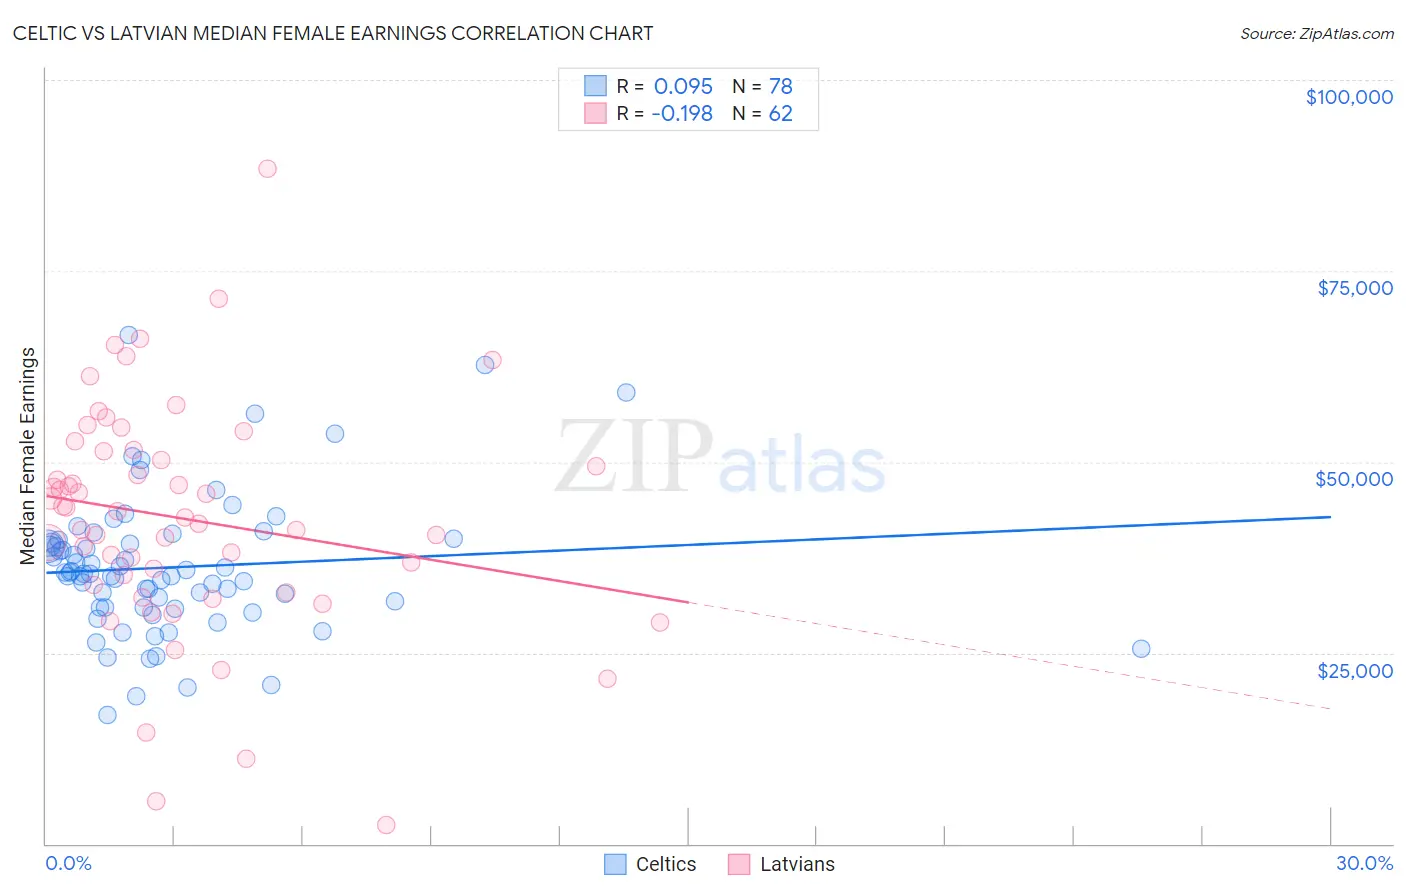
Celtic vs Latvian Median Female Earnings Correlation Chart
The statistical analysis conducted on geographies consisting of 168,839,546 people shows a slight positive correlation between the proportion of Celtics and median female earnings in the United States with a correlation coefficient (R) of 0.095 and weighted average of $38,283. Similarly, the statistical analysis conducted on geographies consisting of 220,706,355 people shows a poor negative correlation between the proportion of Latvians and median female earnings in the United States with a correlation coefficient (R) of -0.198 and weighted average of $43,941, a difference of 14.8%.
Median Female Earnings Correlation Summary
| Measurement | Celtic | Latvian |
| Minimum | $16,819 | $2,499 |
| Maximum | $66,675 | $88,365 |
| Range | $49,856 | $85,866 |
| Mean | $36,202 | $42,555 |
| Median | $35,368 | $43,118 |
| Interquartile 25% (IQ1) | $30,981 | $33,868 |
| Interquartile 75% (IQ3) | $39,367 | $51,451 |
| Interquartile Range (IQR) | $8,386 | $17,583 |
| Standard Deviation (Sample) | $9,110 | $15,211 |
| Standard Deviation (Population) | $9,052 | $15,087 |
Similar Demographics by Median Female Earnings
Demographics Similar to Celtics by Median Female Earnings
In terms of median female earnings, the demographic groups most similar to Celtics are Tongan ($38,288, a difference of 0.010%), Scandinavian ($38,306, a difference of 0.060%), Somali ($38,333, a difference of 0.13%), Basque ($38,352, a difference of 0.18%), and Sudanese ($38,215, a difference of 0.18%).
| Demographics | Rating | Rank | Median Female Earnings |
| Scottish | 6.3 /100 | #227 | Tragic $38,397 |
| Sub-Saharan Africans | 6.2 /100 | #228 | Tragic $38,391 |
| Belgians | 6.1 /100 | #229 | Tragic $38,382 |
| Basques | 5.7 /100 | #230 | Tragic $38,352 |
| Somalis | 5.5 /100 | #231 | Tragic $38,333 |
| Scandinavians | 5.2 /100 | #232 | Tragic $38,306 |
| Tongans | 5.1 /100 | #233 | Tragic $38,288 |
| Celtics | 5.0 /100 | #234 | Tragic $38,283 |
| Sudanese | 4.4 /100 | #235 | Tragic $38,215 |
| Liberians | 4.4 /100 | #236 | Tragic $38,215 |
| Immigrants | Cabo Verde | 4.3 /100 | #237 | Tragic $38,208 |
| Alaska Natives | 4.3 /100 | #238 | Tragic $38,202 |
| English | 4.2 /100 | #239 | Tragic $38,196 |
| Finns | 4.0 /100 | #240 | Tragic $38,173 |
| Spanish | 3.5 /100 | #241 | Tragic $38,098 |
Demographics Similar to Latvians by Median Female Earnings
In terms of median female earnings, the demographic groups most similar to Latvians are Immigrants from Switzerland ($43,996, a difference of 0.12%), Israeli ($43,852, a difference of 0.20%), Immigrants from Malaysia ($43,835, a difference of 0.24%), Immigrants from Turkey ($44,066, a difference of 0.28%), and Immigrants from Sri Lanka ($44,161, a difference of 0.50%).
| Demographics | Rating | Rank | Median Female Earnings |
| Immigrants | France | 100.0 /100 | #31 | Exceptional $44,541 |
| Immigrants | Northern Europe | 100.0 /100 | #32 | Exceptional $44,366 |
| Immigrants | Asia | 100.0 /100 | #33 | Exceptional $44,198 |
| Russians | 100.0 /100 | #34 | Exceptional $44,169 |
| Immigrants | Sri Lanka | 100.0 /100 | #35 | Exceptional $44,161 |
| Immigrants | Turkey | 100.0 /100 | #36 | Exceptional $44,066 |
| Immigrants | Switzerland | 100.0 /100 | #37 | Exceptional $43,996 |
| Latvians | 100.0 /100 | #38 | Exceptional $43,941 |
| Israelis | 100.0 /100 | #39 | Exceptional $43,852 |
| Immigrants | Malaysia | 100.0 /100 | #40 | Exceptional $43,835 |
| Bhutanese | 100.0 /100 | #41 | Exceptional $43,648 |
| Immigrants | Denmark | 100.0 /100 | #42 | Exceptional $43,646 |
| Bulgarians | 100.0 /100 | #43 | Exceptional $43,638 |
| Immigrants | Czechoslovakia | 100.0 /100 | #44 | Exceptional $43,571 |
| Immigrants | Europe | 100.0 /100 | #45 | Exceptional $43,523 |