Yup'ik vs Immigrants from Norway Median Female Earnings
COMPARE
Yup'ik
Immigrants from Norway
Median Female Earnings
Median Female Earnings Comparison
Yup'ik
Immigrants from Norway
$32,730
MEDIAN FEMALE EARNINGS
0.0/ 100
METRIC RATING
342nd/ 347
METRIC RANK
$42,837
MEDIAN FEMALE EARNINGS
99.9/ 100
METRIC RATING
66th/ 347
METRIC RANK
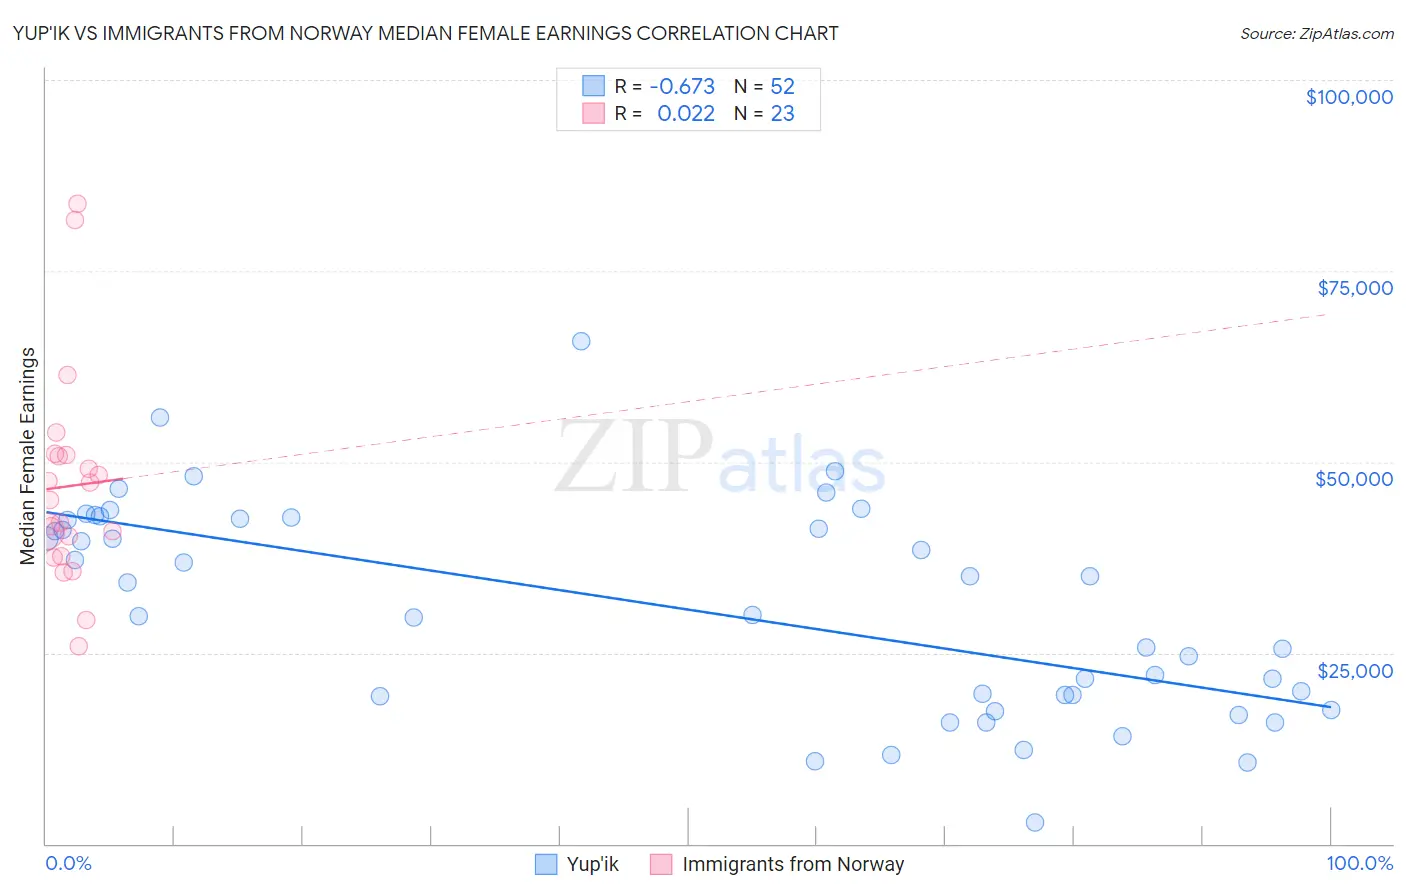
Yup'ik vs Immigrants from Norway Median Female Earnings Correlation Chart
The statistical analysis conducted on geographies consisting of 39,946,861 people shows a significant negative correlation between the proportion of Yup'ik and median female earnings in the United States with a correlation coefficient (R) of -0.673 and weighted average of $32,730. Similarly, the statistical analysis conducted on geographies consisting of 116,697,364 people shows no correlation between the proportion of Immigrants from Norway and median female earnings in the United States with a correlation coefficient (R) of 0.022 and weighted average of $42,837, a difference of 30.9%.
Median Female Earnings Correlation Summary
| Measurement | Yup'ik | Immigrants from Norway |
| Minimum | $2,800 | $25,783 |
| Maximum | $65,833 | $83,727 |
| Range | $63,033 | $57,944 |
| Mean | $30,861 | $46,834 |
| Median | $32,085 | $44,998 |
| Interquartile 25% (IQ1) | $19,410 | $37,628 |
| Interquartile 75% (IQ3) | $42,445 | $50,939 |
| Interquartile Range (IQR) | $23,035 | $13,311 |
| Standard Deviation (Sample) | $13,771 | $13,874 |
| Standard Deviation (Population) | $13,638 | $13,569 |
Similar Demographics by Median Female Earnings
Demographics Similar to Yup'ik by Median Female Earnings
In terms of median female earnings, the demographic groups most similar to Yup'ik are Pueblo ($32,564, a difference of 0.51%), Lumbee ($32,500, a difference of 0.71%), Navajo ($33,046, a difference of 0.96%), Tohono O'odham ($33,205, a difference of 1.5%), and Immigrants from Mexico ($33,236, a difference of 1.5%).
| Demographics | Rating | Rank | Median Female Earnings |
| Mexicans | 0.0 /100 | #333 | Tragic $33,664 |
| Spanish American Indians | 0.0 /100 | #334 | Tragic $33,625 |
| Creek | 0.0 /100 | #335 | Tragic $33,437 |
| Ottawa | 0.0 /100 | #336 | Tragic $33,378 |
| Yakama | 0.0 /100 | #337 | Tragic $33,354 |
| Immigrants | Cuba | 0.0 /100 | #338 | Tragic $33,291 |
| Immigrants | Mexico | 0.0 /100 | #339 | Tragic $33,236 |
| Tohono O'odham | 0.0 /100 | #340 | Tragic $33,205 |
| Navajo | 0.0 /100 | #341 | Tragic $33,046 |
| Yup'ik | 0.0 /100 | #342 | Tragic $32,730 |
| Pueblo | 0.0 /100 | #343 | Tragic $32,564 |
| Lumbee | 0.0 /100 | #344 | Tragic $32,500 |
| Puerto Ricans | 0.0 /100 | #345 | Tragic $31,560 |
| Arapaho | 0.0 /100 | #346 | Tragic $31,489 |
| Houma | 0.0 /100 | #347 | Tragic $30,343 |
Demographics Similar to Immigrants from Norway by Median Female Earnings
In terms of median female earnings, the demographic groups most similar to Immigrants from Norway are Immigrants from Egypt ($42,837, a difference of 0.0%), Immigrants from Austria ($42,824, a difference of 0.030%), Immigrants from Spain ($42,815, a difference of 0.050%), Sierra Leonean ($42,868, a difference of 0.070%), and Immigrants from Ethiopia ($42,744, a difference of 0.22%).
| Demographics | Rating | Rank | Median Female Earnings |
| Estonians | 99.9 /100 | #59 | Exceptional $43,106 |
| Immigrants | Latvia | 99.9 /100 | #60 | Exceptional $43,099 |
| Immigrants | Bulgaria | 99.9 /100 | #61 | Exceptional $43,085 |
| Afghans | 99.9 /100 | #62 | Exceptional $43,077 |
| Immigrants | Ukraine | 99.9 /100 | #63 | Exceptional $43,069 |
| Immigrants | Pakistan | 99.9 /100 | #64 | Exceptional $43,052 |
| Sierra Leoneans | 99.9 /100 | #65 | Exceptional $42,868 |
| Immigrants | Norway | 99.9 /100 | #66 | Exceptional $42,837 |
| Immigrants | Egypt | 99.9 /100 | #67 | Exceptional $42,837 |
| Immigrants | Austria | 99.8 /100 | #68 | Exceptional $42,824 |
| Immigrants | Spain | 99.8 /100 | #69 | Exceptional $42,815 |
| Immigrants | Ethiopia | 99.8 /100 | #70 | Exceptional $42,744 |
| Immigrants | Romania | 99.8 /100 | #71 | Exceptional $42,718 |
| Albanians | 99.8 /100 | #72 | Exceptional $42,584 |
| Mongolians | 99.7 /100 | #73 | Exceptional $42,542 |