Cheyenne vs Immigrants from Kuwait Per Capita Income
COMPARE
Cheyenne
Immigrants from Kuwait
Per Capita Income
Per Capita Income Comparison
Cheyenne
Immigrants from Kuwait
$35,276
PER CAPITA INCOME
0.0/ 100
METRIC RATING
323rd/ 347
METRIC RANK
$46,543
PER CAPITA INCOME
96.2/ 100
METRIC RATING
108th/ 347
METRIC RANK
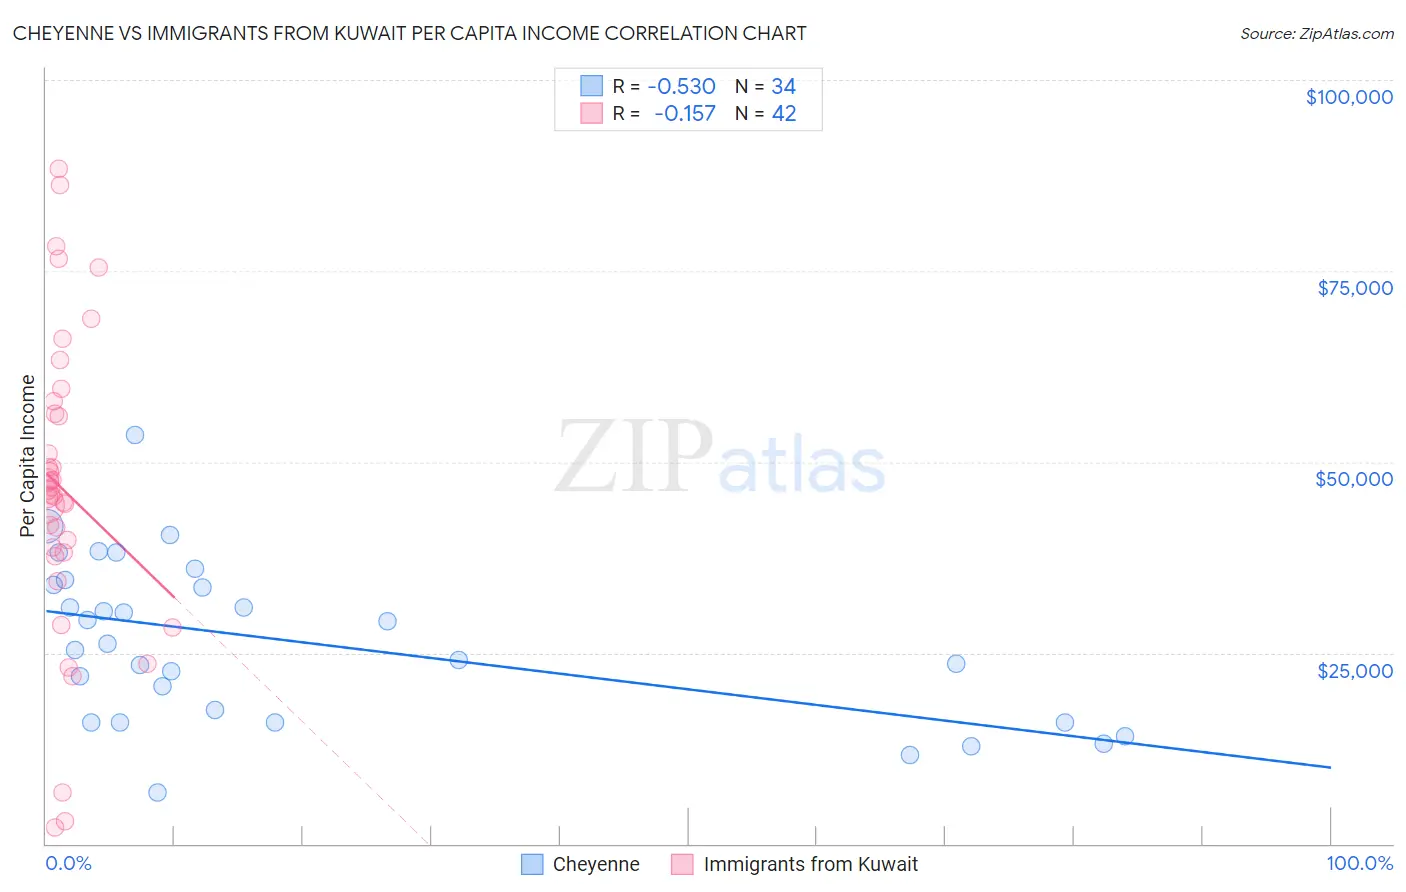
Cheyenne vs Immigrants from Kuwait Per Capita Income Correlation Chart
The statistical analysis conducted on geographies consisting of 80,722,590 people shows a substantial negative correlation between the proportion of Cheyenne and per capita income in the United States with a correlation coefficient (R) of -0.530 and weighted average of $35,276. Similarly, the statistical analysis conducted on geographies consisting of 136,913,885 people shows a poor negative correlation between the proportion of Immigrants from Kuwait and per capita income in the United States with a correlation coefficient (R) of -0.157 and weighted average of $46,543, a difference of 31.9%.
Per Capita Income Correlation Summary
| Measurement | Cheyenne | Immigrants from Kuwait |
| Minimum | $6,772 | $2,068 |
| Maximum | $53,471 | $88,433 |
| Range | $46,699 | $86,365 |
| Mean | $26,352 | $46,335 |
| Median | $25,776 | $46,027 |
| Interquartile 25% (IQ1) | $15,918 | $38,209 |
| Interquartile 75% (IQ3) | $33,955 | $56,277 |
| Interquartile Range (IQR) | $18,037 | $18,068 |
| Standard Deviation (Sample) | $10,544 | $19,760 |
| Standard Deviation (Population) | $10,388 | $19,524 |
Similar Demographics by Per Capita Income
Demographics Similar to Cheyenne by Per Capita Income
In terms of per capita income, the demographic groups most similar to Cheyenne are Kiowa ($35,102, a difference of 0.50%), Creek ($35,546, a difference of 0.76%), Black/African American ($35,564, a difference of 0.82%), Immigrants from Central America ($34,974, a difference of 0.87%), and Immigrants from Cuba ($34,910, a difference of 1.1%).
| Demographics | Rating | Rank | Per Capita Income |
| Choctaw | 0.0 /100 | #316 | Tragic $35,999 |
| Dutch West Indians | 0.0 /100 | #317 | Tragic $35,922 |
| Bangladeshis | 0.0 /100 | #318 | Tragic $35,897 |
| Immigrants | Congo | 0.0 /100 | #319 | Tragic $35,720 |
| Hispanics or Latinos | 0.0 /100 | #320 | Tragic $35,688 |
| Blacks/African Americans | 0.0 /100 | #321 | Tragic $35,564 |
| Creek | 0.0 /100 | #322 | Tragic $35,546 |
| Cheyenne | 0.0 /100 | #323 | Tragic $35,276 |
| Kiowa | 0.0 /100 | #324 | Tragic $35,102 |
| Immigrants | Central America | 0.0 /100 | #325 | Tragic $34,974 |
| Immigrants | Cuba | 0.0 /100 | #326 | Tragic $34,910 |
| Apache | 0.0 /100 | #327 | Tragic $34,886 |
| Menominee | 0.0 /100 | #328 | Tragic $34,578 |
| Mexicans | 0.0 /100 | #329 | Tragic $34,559 |
| Spanish American Indians | 0.0 /100 | #330 | Tragic $34,195 |
Demographics Similar to Immigrants from Kuwait by Per Capita Income
In terms of per capita income, the demographic groups most similar to Immigrants from Kuwait are Serbian ($46,551, a difference of 0.020%), Immigrants from Northern Africa ($46,531, a difference of 0.030%), British ($46,571, a difference of 0.060%), Ethiopian ($46,569, a difference of 0.060%), and Chilean ($46,459, a difference of 0.18%).
| Demographics | Rating | Rank | Per Capita Income |
| Immigrants | Uzbekistan | 97.5 /100 | #101 | Exceptional $46,929 |
| Immigrants | Western Asia | 97.4 /100 | #102 | Exceptional $46,876 |
| Syrians | 97.2 /100 | #103 | Exceptional $46,837 |
| Brazilians | 96.8 /100 | #104 | Exceptional $46,700 |
| British | 96.3 /100 | #105 | Exceptional $46,571 |
| Ethiopians | 96.3 /100 | #106 | Exceptional $46,569 |
| Serbians | 96.2 /100 | #107 | Exceptional $46,551 |
| Immigrants | Kuwait | 96.2 /100 | #108 | Exceptional $46,543 |
| Immigrants | Northern Africa | 96.2 /100 | #109 | Exceptional $46,531 |
| Chileans | 95.9 /100 | #110 | Exceptional $46,459 |
| Taiwanese | 95.8 /100 | #111 | Exceptional $46,455 |
| Immigrants | Morocco | 95.7 /100 | #112 | Exceptional $46,430 |
| Immigrants | Albania | 95.5 /100 | #113 | Exceptional $46,387 |
| Afghans | 94.9 /100 | #114 | Exceptional $46,268 |
| Immigrants | Chile | 94.6 /100 | #115 | Exceptional $46,213 |