Cheyenne vs Austrian Per Capita Income
COMPARE
Cheyenne
Austrian
Per Capita Income
Per Capita Income Comparison
Cheyenne
Austrians
$35,276
PER CAPITA INCOME
0.0/ 100
METRIC RATING
323rd/ 347
METRIC RANK
$48,116
PER CAPITA INCOME
99.3/ 100
METRIC RATING
85th/ 347
METRIC RANK
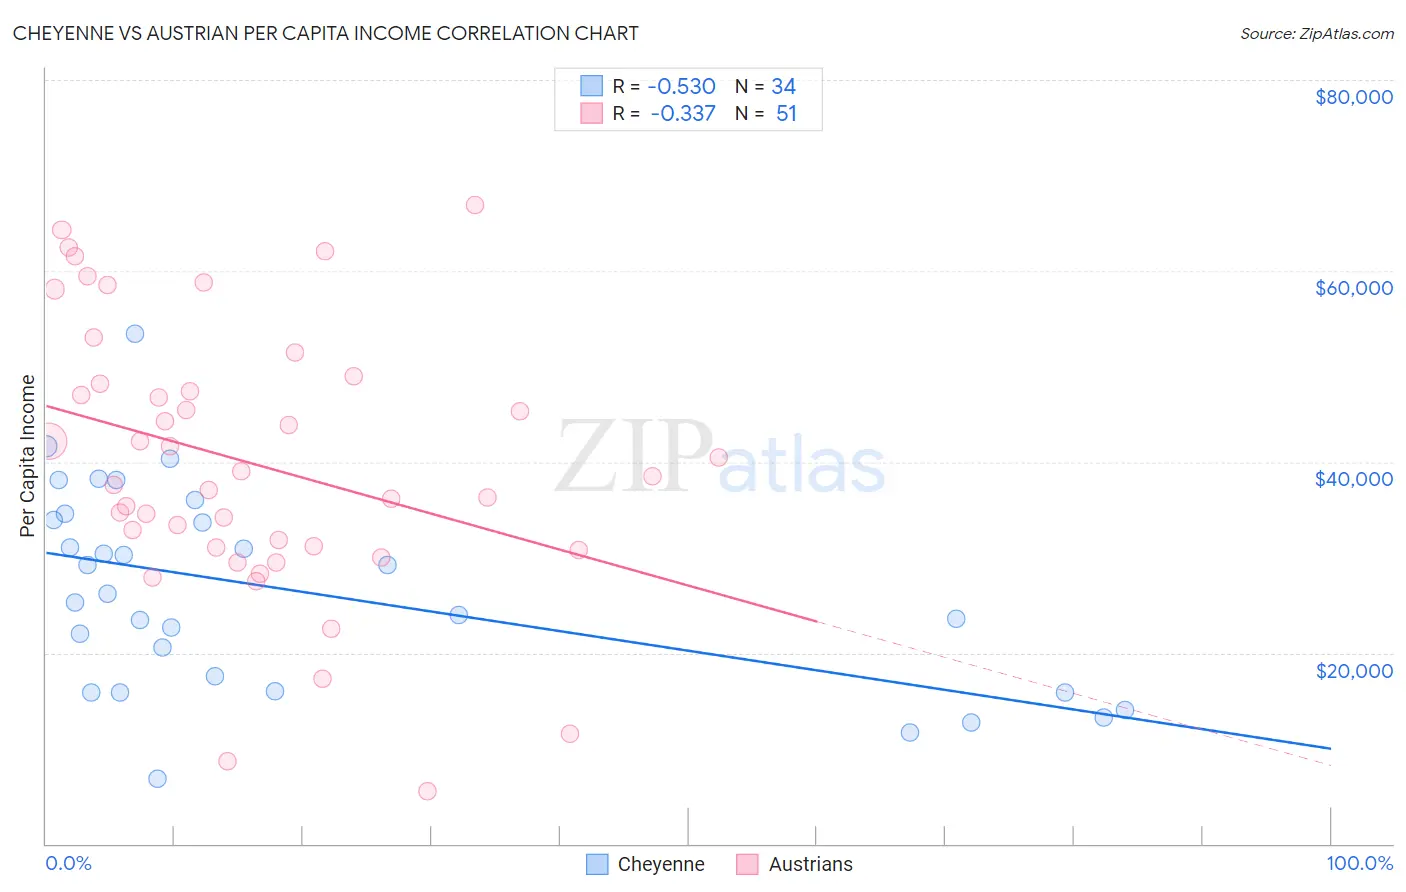
Cheyenne vs Austrian Per Capita Income Correlation Chart
The statistical analysis conducted on geographies consisting of 80,722,590 people shows a substantial negative correlation between the proportion of Cheyenne and per capita income in the United States with a correlation coefficient (R) of -0.530 and weighted average of $35,276. Similarly, the statistical analysis conducted on geographies consisting of 452,103,489 people shows a mild negative correlation between the proportion of Austrians and per capita income in the United States with a correlation coefficient (R) of -0.337 and weighted average of $48,116, a difference of 36.4%.
Per Capita Income Correlation Summary
| Measurement | Cheyenne | Austrian |
| Minimum | $6,772 | $5,500 |
| Maximum | $53,471 | $66,908 |
| Range | $46,699 | $61,408 |
| Mean | $26,352 | $39,852 |
| Median | $25,776 | $38,439 |
| Interquartile 25% (IQ1) | $15,918 | $31,067 |
| Interquartile 75% (IQ3) | $33,955 | $48,128 |
| Interquartile Range (IQR) | $18,037 | $17,061 |
| Standard Deviation (Sample) | $10,544 | $14,137 |
| Standard Deviation (Population) | $10,388 | $13,998 |
Similar Demographics by Per Capita Income
Demographics Similar to Cheyenne by Per Capita Income
In terms of per capita income, the demographic groups most similar to Cheyenne are Kiowa ($35,102, a difference of 0.50%), Creek ($35,546, a difference of 0.76%), Black/African American ($35,564, a difference of 0.82%), Immigrants from Central America ($34,974, a difference of 0.87%), and Immigrants from Cuba ($34,910, a difference of 1.1%).
| Demographics | Rating | Rank | Per Capita Income |
| Choctaw | 0.0 /100 | #316 | Tragic $35,999 |
| Dutch West Indians | 0.0 /100 | #317 | Tragic $35,922 |
| Bangladeshis | 0.0 /100 | #318 | Tragic $35,897 |
| Immigrants | Congo | 0.0 /100 | #319 | Tragic $35,720 |
| Hispanics or Latinos | 0.0 /100 | #320 | Tragic $35,688 |
| Blacks/African Americans | 0.0 /100 | #321 | Tragic $35,564 |
| Creek | 0.0 /100 | #322 | Tragic $35,546 |
| Cheyenne | 0.0 /100 | #323 | Tragic $35,276 |
| Kiowa | 0.0 /100 | #324 | Tragic $35,102 |
| Immigrants | Central America | 0.0 /100 | #325 | Tragic $34,974 |
| Immigrants | Cuba | 0.0 /100 | #326 | Tragic $34,910 |
| Apache | 0.0 /100 | #327 | Tragic $34,886 |
| Menominee | 0.0 /100 | #328 | Tragic $34,578 |
| Mexicans | 0.0 /100 | #329 | Tragic $34,559 |
| Spanish American Indians | 0.0 /100 | #330 | Tragic $34,195 |
Demographics Similar to Austrians by Per Capita Income
In terms of per capita income, the demographic groups most similar to Austrians are Immigrants from Ukraine ($48,134, a difference of 0.040%), Immigrants from Brazil ($48,164, a difference of 0.10%), Immigrants from Indonesia ($48,195, a difference of 0.16%), Immigrants from Southern Europe ($48,027, a difference of 0.18%), and Ukrainian ($48,014, a difference of 0.21%).
| Demographics | Rating | Rank | Per Capita Income |
| Immigrants | Italy | 99.6 /100 | #78 | Exceptional $48,654 |
| Romanians | 99.5 /100 | #79 | Exceptional $48,445 |
| Egyptians | 99.5 /100 | #80 | Exceptional $48,358 |
| Armenians | 99.4 /100 | #81 | Exceptional $48,287 |
| Immigrants | Indonesia | 99.4 /100 | #82 | Exceptional $48,195 |
| Immigrants | Brazil | 99.4 /100 | #83 | Exceptional $48,164 |
| Immigrants | Ukraine | 99.3 /100 | #84 | Exceptional $48,134 |
| Austrians | 99.3 /100 | #85 | Exceptional $48,116 |
| Immigrants | Southern Europe | 99.3 /100 | #86 | Exceptional $48,027 |
| Ukrainians | 99.3 /100 | #87 | Exceptional $48,014 |
| Croatians | 99.0 /100 | #88 | Exceptional $47,742 |
| Northern Europeans | 98.9 /100 | #89 | Exceptional $47,698 |
| Italians | 98.8 /100 | #90 | Exceptional $47,574 |
| Macedonians | 98.8 /100 | #91 | Exceptional $47,573 |
| Immigrants | Moldova | 98.7 /100 | #92 | Exceptional $47,489 |