Navajo vs Immigrants from Kuwait Per Capita Income
COMPARE
Navajo
Immigrants from Kuwait
Per Capita Income
Per Capita Income Comparison
Navajo
Immigrants from Kuwait
$29,031
PER CAPITA INCOME
0.0/ 100
METRIC RATING
347th/ 347
METRIC RANK
$46,543
PER CAPITA INCOME
96.2/ 100
METRIC RATING
108th/ 347
METRIC RANK
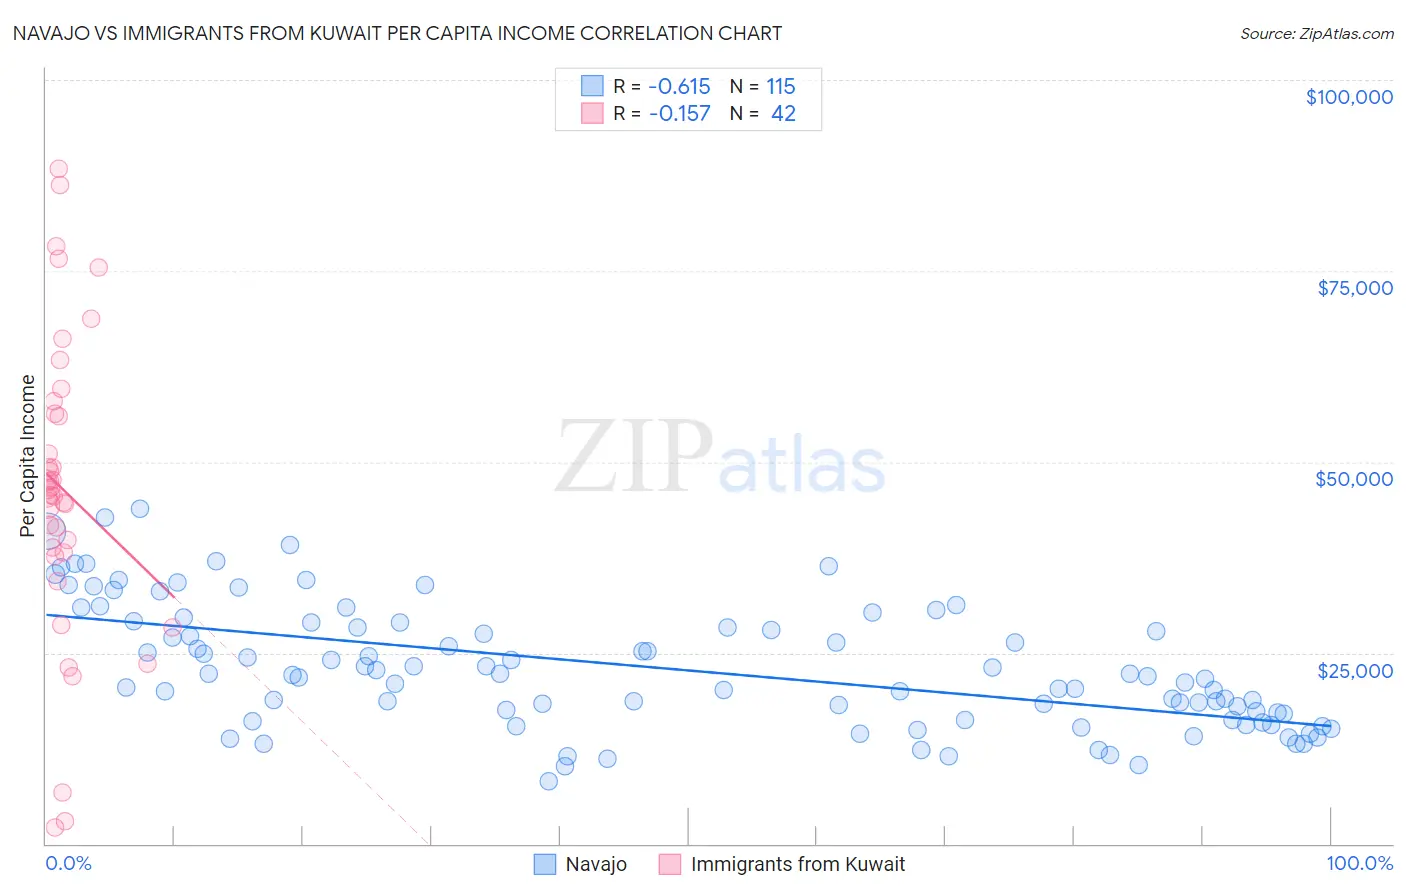
Navajo vs Immigrants from Kuwait Per Capita Income Correlation Chart
The statistical analysis conducted on geographies consisting of 224,872,448 people shows a significant negative correlation between the proportion of Navajo and per capita income in the United States with a correlation coefficient (R) of -0.615 and weighted average of $29,031. Similarly, the statistical analysis conducted on geographies consisting of 136,913,885 people shows a poor negative correlation between the proportion of Immigrants from Kuwait and per capita income in the United States with a correlation coefficient (R) of -0.157 and weighted average of $46,543, a difference of 60.3%.
Per Capita Income Correlation Summary
| Measurement | Navajo | Immigrants from Kuwait |
| Minimum | $8,247 | $2,068 |
| Maximum | $43,851 | $88,433 |
| Range | $35,604 | $86,365 |
| Mean | $22,991 | $46,335 |
| Median | $21,965 | $46,027 |
| Interquartile 25% (IQ1) | $16,235 | $38,209 |
| Interquartile 75% (IQ3) | $28,907 | $56,277 |
| Interquartile Range (IQR) | $12,672 | $18,068 |
| Standard Deviation (Sample) | $8,079 | $19,760 |
| Standard Deviation (Population) | $8,043 | $19,524 |
Similar Demographics by Per Capita Income
Demographics Similar to Navajo by Per Capita Income
In terms of per capita income, the demographic groups most similar to Navajo are Lumbee ($29,845, a difference of 2.8%), Tohono O'odham ($30,256, a difference of 4.2%), Yup'ik ($30,518, a difference of 5.1%), Pima ($30,644, a difference of 5.6%), and Hopi ($31,177, a difference of 7.4%).
| Demographics | Rating | Rank | Per Capita Income |
| Immigrants | Yemen | 0.0 /100 | #333 | Tragic $33,696 |
| Natives/Alaskans | 0.0 /100 | #334 | Tragic $33,279 |
| Yuman | 0.0 /100 | #335 | Tragic $33,236 |
| Yakama | 0.0 /100 | #336 | Tragic $33,009 |
| Houma | 0.0 /100 | #337 | Tragic $32,996 |
| Arapaho | 0.0 /100 | #338 | Tragic $32,345 |
| Pueblo | 0.0 /100 | #339 | Tragic $32,012 |
| Crow | 0.0 /100 | #340 | Tragic $31,729 |
| Puerto Ricans | 0.0 /100 | #341 | Tragic $31,268 |
| Hopi | 0.0 /100 | #342 | Tragic $31,177 |
| Pima | 0.0 /100 | #343 | Tragic $30,644 |
| Yup'ik | 0.0 /100 | #344 | Tragic $30,518 |
| Tohono O'odham | 0.0 /100 | #345 | Tragic $30,256 |
| Lumbee | 0.0 /100 | #346 | Tragic $29,845 |
| Navajo | 0.0 /100 | #347 | Tragic $29,031 |
Demographics Similar to Immigrants from Kuwait by Per Capita Income
In terms of per capita income, the demographic groups most similar to Immigrants from Kuwait are Serbian ($46,551, a difference of 0.020%), Immigrants from Northern Africa ($46,531, a difference of 0.030%), British ($46,571, a difference of 0.060%), Ethiopian ($46,569, a difference of 0.060%), and Chilean ($46,459, a difference of 0.18%).
| Demographics | Rating | Rank | Per Capita Income |
| Immigrants | Uzbekistan | 97.5 /100 | #101 | Exceptional $46,929 |
| Immigrants | Western Asia | 97.4 /100 | #102 | Exceptional $46,876 |
| Syrians | 97.2 /100 | #103 | Exceptional $46,837 |
| Brazilians | 96.8 /100 | #104 | Exceptional $46,700 |
| British | 96.3 /100 | #105 | Exceptional $46,571 |
| Ethiopians | 96.3 /100 | #106 | Exceptional $46,569 |
| Serbians | 96.2 /100 | #107 | Exceptional $46,551 |
| Immigrants | Kuwait | 96.2 /100 | #108 | Exceptional $46,543 |
| Immigrants | Northern Africa | 96.2 /100 | #109 | Exceptional $46,531 |
| Chileans | 95.9 /100 | #110 | Exceptional $46,459 |
| Taiwanese | 95.8 /100 | #111 | Exceptional $46,455 |
| Immigrants | Morocco | 95.7 /100 | #112 | Exceptional $46,430 |
| Immigrants | Albania | 95.5 /100 | #113 | Exceptional $46,387 |
| Afghans | 94.9 /100 | #114 | Exceptional $46,268 |
| Immigrants | Chile | 94.6 /100 | #115 | Exceptional $46,213 |