Cheyenne vs Immigrants from Iran Per Capita Income
COMPARE
Cheyenne
Immigrants from Iran
Per Capita Income
Per Capita Income Comparison
Cheyenne
Immigrants from Iran
$35,276
PER CAPITA INCOME
0.0/ 100
METRIC RATING
323rd/ 347
METRIC RANK
$57,759
PER CAPITA INCOME
100.0/ 100
METRIC RATING
5th/ 347
METRIC RANK
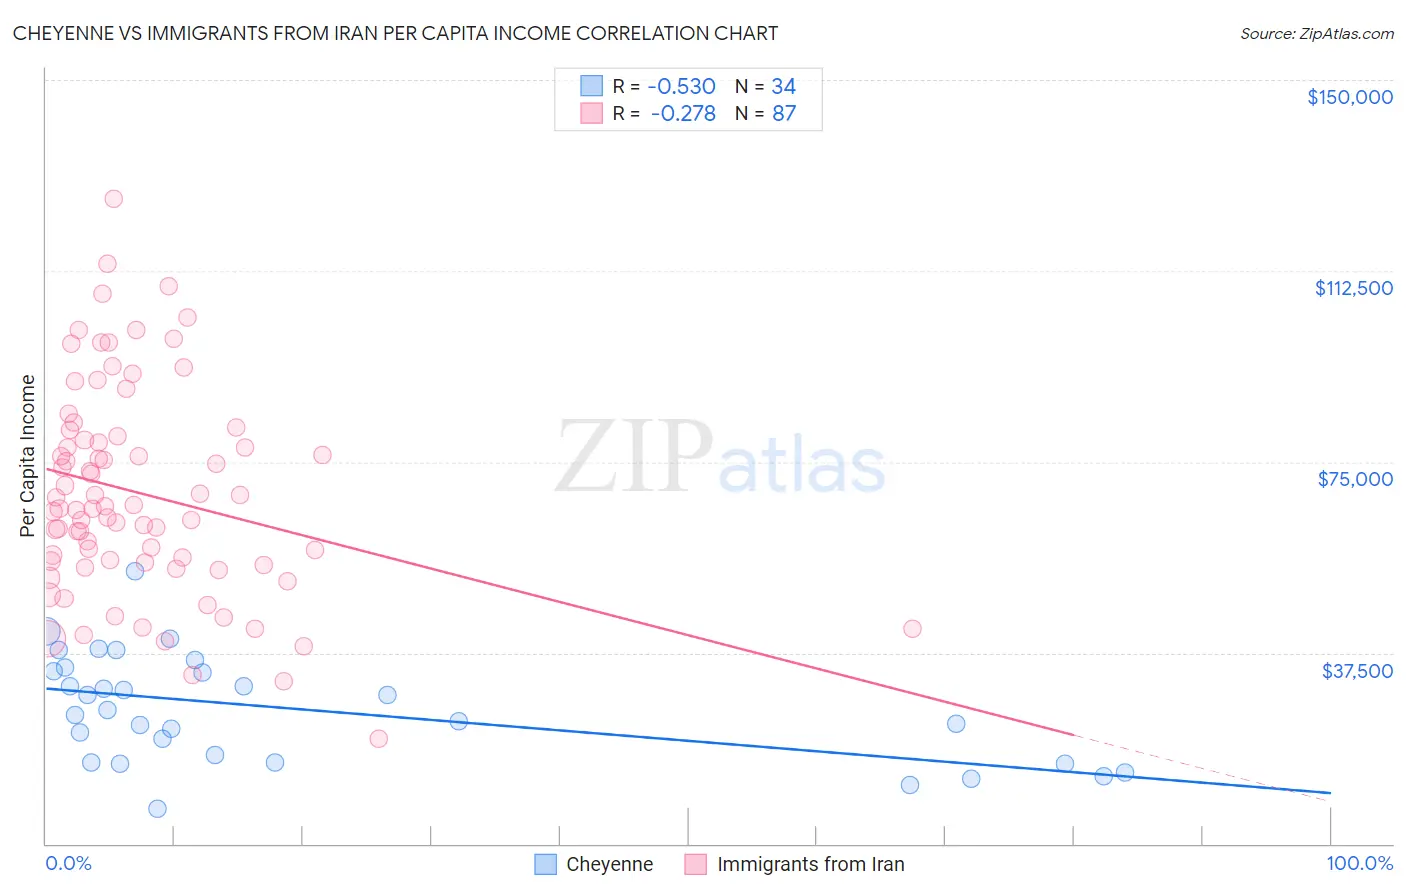
Cheyenne vs Immigrants from Iran Per Capita Income Correlation Chart
The statistical analysis conducted on geographies consisting of 80,722,590 people shows a substantial negative correlation between the proportion of Cheyenne and per capita income in the United States with a correlation coefficient (R) of -0.530 and weighted average of $35,276. Similarly, the statistical analysis conducted on geographies consisting of 279,905,207 people shows a weak negative correlation between the proportion of Immigrants from Iran and per capita income in the United States with a correlation coefficient (R) of -0.278 and weighted average of $57,759, a difference of 63.7%.
Per Capita Income Correlation Summary
| Measurement | Cheyenne | Immigrants from Iran |
| Minimum | $6,772 | $20,655 |
| Maximum | $53,471 | $126,563 |
| Range | $46,699 | $105,908 |
| Mean | $26,352 | $68,785 |
| Median | $25,776 | $65,816 |
| Interquartile 25% (IQ1) | $15,918 | $55,345 |
| Interquartile 75% (IQ3) | $33,955 | $79,969 |
| Interquartile Range (IQR) | $18,037 | $24,624 |
| Standard Deviation (Sample) | $10,544 | $20,524 |
| Standard Deviation (Population) | $10,388 | $20,406 |
Similar Demographics by Per Capita Income
Demographics Similar to Cheyenne by Per Capita Income
In terms of per capita income, the demographic groups most similar to Cheyenne are Kiowa ($35,102, a difference of 0.50%), Creek ($35,546, a difference of 0.76%), Black/African American ($35,564, a difference of 0.82%), Immigrants from Central America ($34,974, a difference of 0.87%), and Immigrants from Cuba ($34,910, a difference of 1.1%).
| Demographics | Rating | Rank | Per Capita Income |
| Choctaw | 0.0 /100 | #316 | Tragic $35,999 |
| Dutch West Indians | 0.0 /100 | #317 | Tragic $35,922 |
| Bangladeshis | 0.0 /100 | #318 | Tragic $35,897 |
| Immigrants | Congo | 0.0 /100 | #319 | Tragic $35,720 |
| Hispanics or Latinos | 0.0 /100 | #320 | Tragic $35,688 |
| Blacks/African Americans | 0.0 /100 | #321 | Tragic $35,564 |
| Creek | 0.0 /100 | #322 | Tragic $35,546 |
| Cheyenne | 0.0 /100 | #323 | Tragic $35,276 |
| Kiowa | 0.0 /100 | #324 | Tragic $35,102 |
| Immigrants | Central America | 0.0 /100 | #325 | Tragic $34,974 |
| Immigrants | Cuba | 0.0 /100 | #326 | Tragic $34,910 |
| Apache | 0.0 /100 | #327 | Tragic $34,886 |
| Menominee | 0.0 /100 | #328 | Tragic $34,578 |
| Mexicans | 0.0 /100 | #329 | Tragic $34,559 |
| Spanish American Indians | 0.0 /100 | #330 | Tragic $34,195 |
Demographics Similar to Immigrants from Iran by Per Capita Income
In terms of per capita income, the demographic groups most similar to Immigrants from Iran are Immigrants from Taiwan ($57,742, a difference of 0.030%), Immigrants from Australia ($57,953, a difference of 0.34%), Immigrants from Israel ($57,384, a difference of 0.65%), Immigrants from Singapore ($58,353, a difference of 1.0%), and Iranian ($58,786, a difference of 1.8%).
| Demographics | Rating | Rank | Per Capita Income |
| Filipinos | 100.0 /100 | #1 | Exceptional $59,066 |
| Iranians | 100.0 /100 | #2 | Exceptional $58,786 |
| Immigrants | Singapore | 100.0 /100 | #3 | Exceptional $58,353 |
| Immigrants | Australia | 100.0 /100 | #4 | Exceptional $57,953 |
| Immigrants | Iran | 100.0 /100 | #5 | Exceptional $57,759 |
| Immigrants | Taiwan | 100.0 /100 | #6 | Exceptional $57,742 |
| Immigrants | Israel | 100.0 /100 | #7 | Exceptional $57,384 |
| Immigrants | Hong Kong | 100.0 /100 | #8 | Exceptional $56,709 |
| Immigrants | Ireland | 100.0 /100 | #9 | Exceptional $56,584 |
| Okinawans | 100.0 /100 | #10 | Exceptional $55,817 |
| Eastern Europeans | 100.0 /100 | #11 | Exceptional $55,780 |
| Immigrants | Sweden | 100.0 /100 | #12 | Exceptional $55,582 |
| Immigrants | India | 100.0 /100 | #13 | Exceptional $55,268 |
| Immigrants | Belgium | 100.0 /100 | #14 | Exceptional $55,082 |
| Cypriots | 100.0 /100 | #15 | Exceptional $54,899 |