Swedish vs Immigrants from Kuwait Per Capita Income
COMPARE
Swedish
Immigrants from Kuwait
Per Capita Income
Per Capita Income Comparison
Swedes
Immigrants from Kuwait
$45,750
PER CAPITA INCOME
91.3/ 100
METRIC RATING
128th/ 347
METRIC RANK
$46,543
PER CAPITA INCOME
96.2/ 100
METRIC RATING
108th/ 347
METRIC RANK
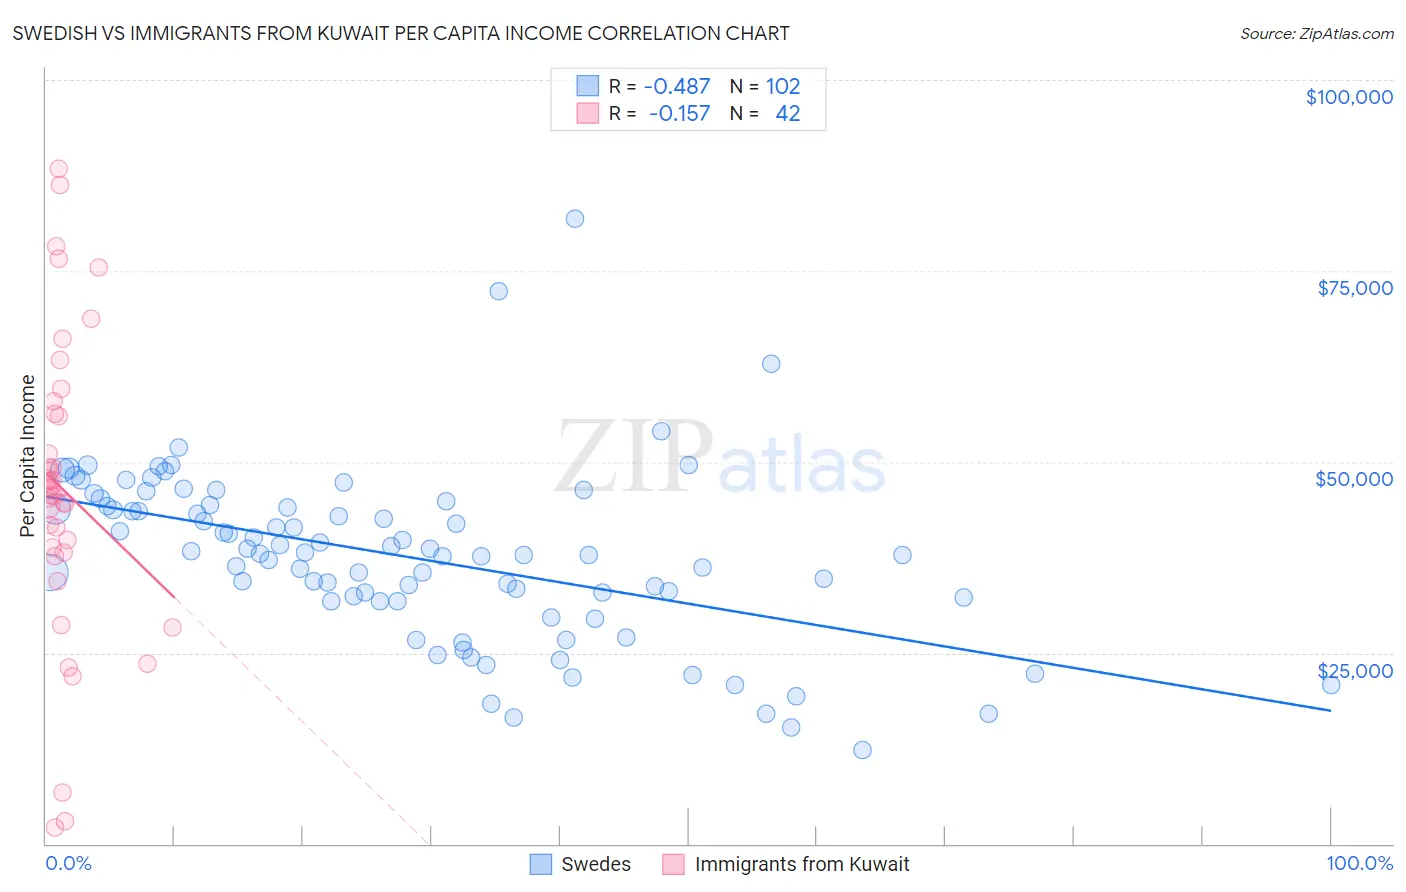
Swedish vs Immigrants from Kuwait Per Capita Income Correlation Chart
The statistical analysis conducted on geographies consisting of 539,281,463 people shows a moderate negative correlation between the proportion of Swedes and per capita income in the United States with a correlation coefficient (R) of -0.487 and weighted average of $45,750. Similarly, the statistical analysis conducted on geographies consisting of 136,913,885 people shows a poor negative correlation between the proportion of Immigrants from Kuwait and per capita income in the United States with a correlation coefficient (R) of -0.157 and weighted average of $46,543, a difference of 1.7%.
Per Capita Income Correlation Summary
| Measurement | Swedish | Immigrants from Kuwait |
| Minimum | $12,332 | $2,068 |
| Maximum | $81,765 | $88,433 |
| Range | $69,433 | $86,365 |
| Mean | $37,501 | $46,335 |
| Median | $37,895 | $46,027 |
| Interquartile 25% (IQ1) | $31,815 | $38,209 |
| Interquartile 75% (IQ3) | $44,149 | $56,277 |
| Interquartile Range (IQR) | $12,334 | $18,068 |
| Standard Deviation (Sample) | $11,325 | $19,760 |
| Standard Deviation (Population) | $11,269 | $19,524 |
Demographics Similar to Swedes and Immigrants from Kuwait by Per Capita Income
In terms of per capita income, the demographic groups most similar to Swedes are Immigrants from Germany ($45,751, a difference of 0.0%), Palestinian ($45,790, a difference of 0.090%), Zimbabwean ($45,804, a difference of 0.12%), European ($45,836, a difference of 0.19%), and Lebanese ($45,840, a difference of 0.20%). Similarly, the demographic groups most similar to Immigrants from Kuwait are Immigrants from Northern Africa ($46,531, a difference of 0.030%), Chilean ($46,459, a difference of 0.18%), Taiwanese ($46,455, a difference of 0.19%), Immigrants from Morocco ($46,430, a difference of 0.24%), and Immigrants from Albania ($46,387, a difference of 0.33%).
| Demographics | Rating | Rank | Per Capita Income |
| Immigrants | Kuwait | 96.2 /100 | #108 | Exceptional $46,543 |
| Immigrants | Northern Africa | 96.2 /100 | #109 | Exceptional $46,531 |
| Chileans | 95.9 /100 | #110 | Exceptional $46,459 |
| Taiwanese | 95.8 /100 | #111 | Exceptional $46,455 |
| Immigrants | Morocco | 95.7 /100 | #112 | Exceptional $46,430 |
| Immigrants | Albania | 95.5 /100 | #113 | Exceptional $46,387 |
| Afghans | 94.9 /100 | #114 | Exceptional $46,268 |
| Immigrants | Chile | 94.6 /100 | #115 | Exceptional $46,213 |
| Poles | 94.1 /100 | #116 | Exceptional $46,123 |
| Chinese | 93.9 /100 | #117 | Exceptional $46,098 |
| Immigrants | Saudi Arabia | 93.3 /100 | #118 | Exceptional $46,008 |
| Immigrants | Poland | 93.1 /100 | #119 | Exceptional $45,979 |
| Immigrants | Ethiopia | 92.7 /100 | #120 | Exceptional $45,923 |
| Canadians | 92.2 /100 | #121 | Exceptional $45,858 |
| Moroccans | 92.1 /100 | #122 | Exceptional $45,854 |
| Lebanese | 92.0 /100 | #123 | Exceptional $45,840 |
| Europeans | 92.0 /100 | #124 | Exceptional $45,836 |
| Zimbabweans | 91.7 /100 | #125 | Exceptional $45,804 |
| Palestinians | 91.6 /100 | #126 | Exceptional $45,790 |
| Immigrants | Germany | 91.3 /100 | #127 | Exceptional $45,751 |
| Swedes | 91.3 /100 | #128 | Exceptional $45,750 |