Cambodian vs Immigrants from France Median Family Income
COMPARE
Cambodian
Immigrants from France
Median Family Income
Median Family Income Comparison
Cambodians
Immigrants from France
$117,780
MEDIAN FAMILY INCOME
100.0/ 100
METRIC RATING
44th/ 347
METRIC RANK
$120,076
MEDIAN FAMILY INCOME
100.0/ 100
METRIC RATING
31st/ 347
METRIC RANK
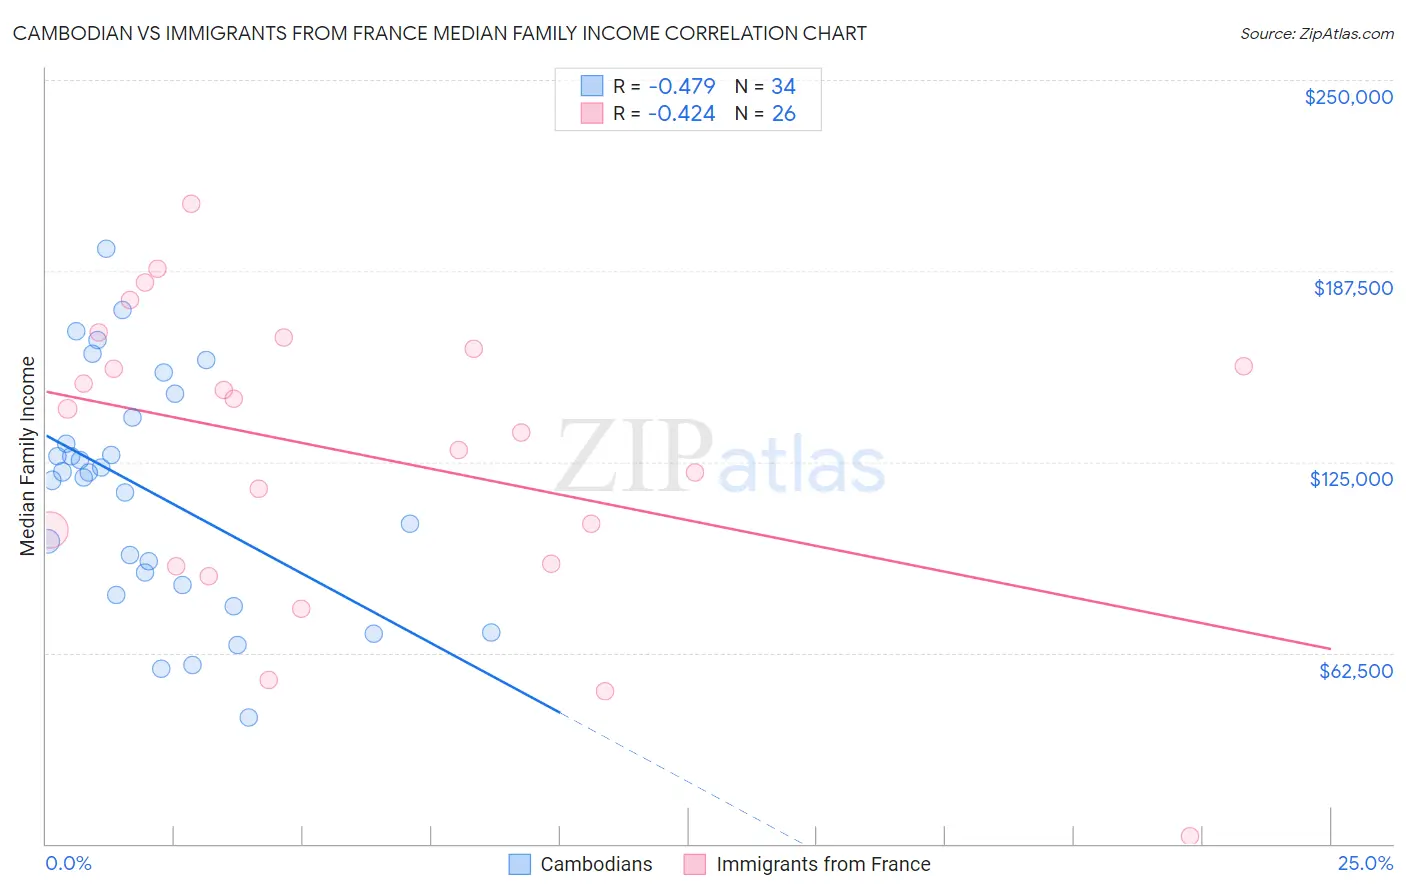
Cambodian vs Immigrants from France Median Family Income Correlation Chart
The statistical analysis conducted on geographies consisting of 102,461,045 people shows a moderate negative correlation between the proportion of Cambodians and median family income in the United States with a correlation coefficient (R) of -0.479 and weighted average of $117,780. Similarly, the statistical analysis conducted on geographies consisting of 287,827,104 people shows a moderate negative correlation between the proportion of Immigrants from France and median family income in the United States with a correlation coefficient (R) of -0.424 and weighted average of $120,076, a difference of 1.9%.
Median Family Income Correlation Summary
| Measurement | Cambodian | Immigrants from France |
| Minimum | $41,250 | $2,499 |
| Maximum | $194,752 | $209,360 |
| Range | $153,502 | $206,861 |
| Mean | $114,811 | $127,499 |
| Median | $120,749 | $138,617 |
| Interquartile 25% (IQ1) | $84,853 | $91,458 |
| Interquartile 75% (IQ3) | $139,722 | $162,000 |
| Interquartile Range (IQR) | $54,869 | $70,542 |
| Standard Deviation (Sample) | $37,903 | $48,457 |
| Standard Deviation (Population) | $37,342 | $47,516 |
Demographics Similar to Cambodians and Immigrants from France by Median Family Income
In terms of median family income, the demographic groups most similar to Cambodians are Bulgarian ($117,818, a difference of 0.030%), Immigrants from Bolivia ($117,912, a difference of 0.11%), Estonian ($118,013, a difference of 0.20%), Immigrants from Lithuania ($118,053, a difference of 0.23%), and Immigrants from Greece ($117,344, a difference of 0.37%). Similarly, the demographic groups most similar to Immigrants from France are Asian ($119,955, a difference of 0.10%), Immigrants from Sri Lanka ($120,263, a difference of 0.16%), Latvian ($120,301, a difference of 0.19%), Bhutanese ($119,800, a difference of 0.23%), and Immigrants from Denmark ($120,445, a difference of 0.31%).
| Demographics | Rating | Rank | Median Family Income |
| Russians | 100.0 /100 | #27 | Exceptional $120,487 |
| Immigrants | Denmark | 100.0 /100 | #28 | Exceptional $120,445 |
| Latvians | 100.0 /100 | #29 | Exceptional $120,301 |
| Immigrants | Sri Lanka | 100.0 /100 | #30 | Exceptional $120,263 |
| Immigrants | France | 100.0 /100 | #31 | Exceptional $120,076 |
| Asians | 100.0 /100 | #32 | Exceptional $119,955 |
| Bhutanese | 100.0 /100 | #33 | Exceptional $119,800 |
| Bolivians | 100.0 /100 | #34 | Exceptional $119,479 |
| Soviet Union | 100.0 /100 | #35 | Exceptional $119,262 |
| Israelis | 100.0 /100 | #36 | Exceptional $118,577 |
| Australians | 100.0 /100 | #37 | Exceptional $118,440 |
| Immigrants | Turkey | 100.0 /100 | #38 | Exceptional $118,325 |
| Immigrants | Asia | 100.0 /100 | #39 | Exceptional $118,291 |
| Immigrants | Lithuania | 100.0 /100 | #40 | Exceptional $118,053 |
| Estonians | 100.0 /100 | #41 | Exceptional $118,013 |
| Immigrants | Bolivia | 100.0 /100 | #42 | Exceptional $117,912 |
| Bulgarians | 100.0 /100 | #43 | Exceptional $117,818 |
| Cambodians | 100.0 /100 | #44 | Exceptional $117,780 |
| Immigrants | Greece | 99.9 /100 | #45 | Exceptional $117,344 |
| Immigrants | Russia | 99.9 /100 | #46 | Exceptional $116,942 |
| Immigrants | Austria | 99.9 /100 | #47 | Exceptional $116,830 |