Cambodian vs Immigrants from Nicaragua Median Family Income
COMPARE
Cambodian
Immigrants from Nicaragua
Median Family Income
Median Family Income Comparison
Cambodians
Immigrants from Nicaragua
$117,780
MEDIAN FAMILY INCOME
100.0/ 100
METRIC RATING
44th/ 347
METRIC RANK
$88,267
MEDIAN FAMILY INCOME
0.1/ 100
METRIC RATING
286th/ 347
METRIC RANK
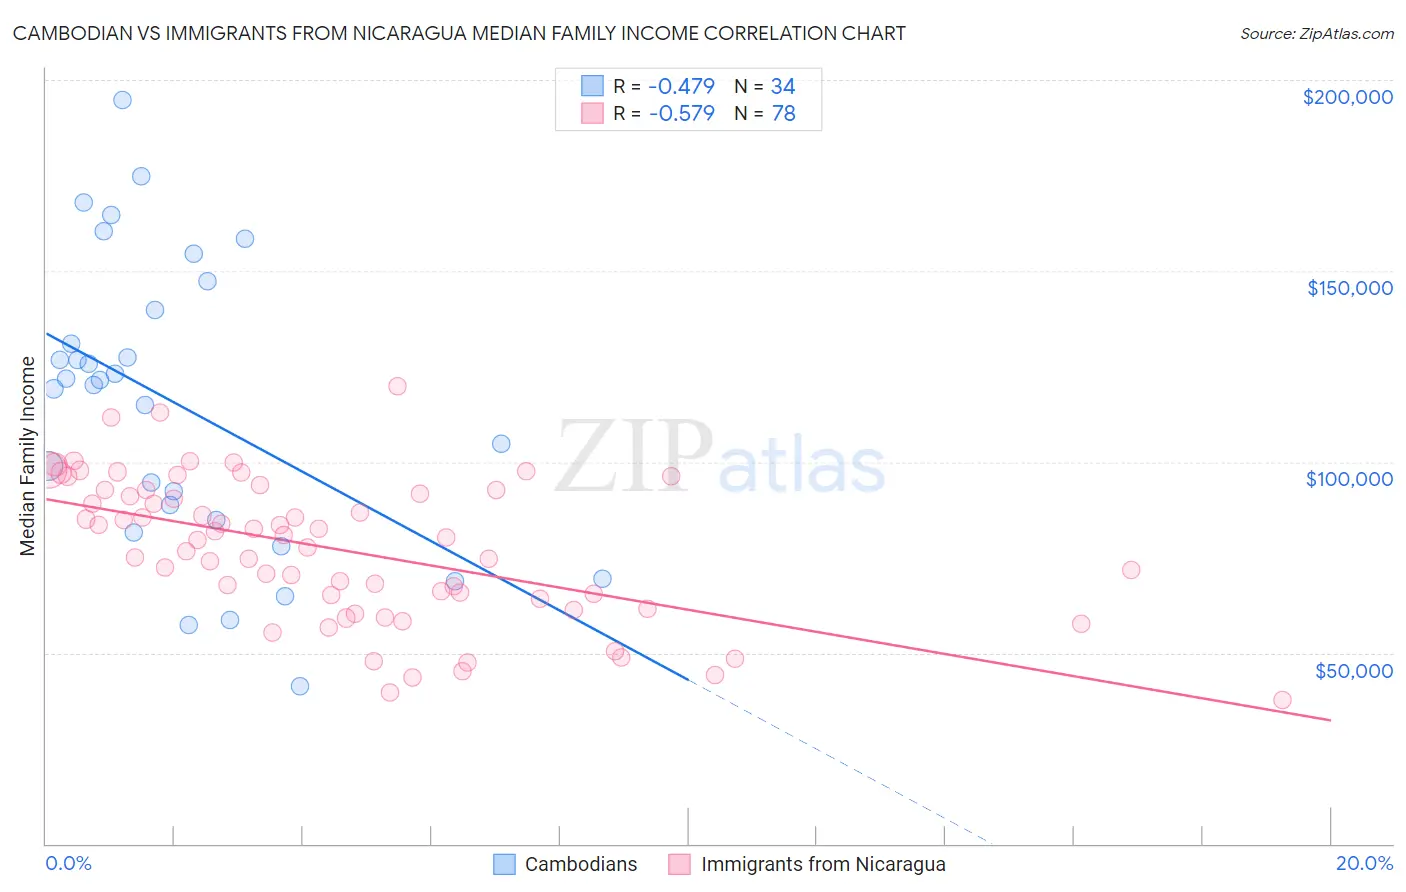
Cambodian vs Immigrants from Nicaragua Median Family Income Correlation Chart
The statistical analysis conducted on geographies consisting of 102,461,045 people shows a moderate negative correlation between the proportion of Cambodians and median family income in the United States with a correlation coefficient (R) of -0.479 and weighted average of $117,780. Similarly, the statistical analysis conducted on geographies consisting of 236,310,703 people shows a substantial negative correlation between the proportion of Immigrants from Nicaragua and median family income in the United States with a correlation coefficient (R) of -0.579 and weighted average of $88,267, a difference of 33.4%.
Median Family Income Correlation Summary
| Measurement | Cambodian | Immigrants from Nicaragua |
| Minimum | $41,250 | $37,806 |
| Maximum | $194,752 | $119,688 |
| Range | $153,502 | $81,882 |
| Mean | $114,811 | $77,073 |
| Median | $120,749 | $79,725 |
| Interquartile 25% (IQ1) | $84,853 | $64,231 |
| Interquartile 75% (IQ3) | $139,722 | $92,500 |
| Interquartile Range (IQR) | $54,869 | $28,269 |
| Standard Deviation (Sample) | $37,903 | $18,710 |
| Standard Deviation (Population) | $37,342 | $18,590 |
Similar Demographics by Median Family Income
Demographics Similar to Cambodians by Median Family Income
In terms of median family income, the demographic groups most similar to Cambodians are Bulgarian ($117,818, a difference of 0.030%), Immigrants from Bolivia ($117,912, a difference of 0.11%), Estonian ($118,013, a difference of 0.20%), Immigrants from Lithuania ($118,053, a difference of 0.23%), and Immigrants from Greece ($117,344, a difference of 0.37%).
| Demographics | Rating | Rank | Median Family Income |
| Australians | 100.0 /100 | #37 | Exceptional $118,440 |
| Immigrants | Turkey | 100.0 /100 | #38 | Exceptional $118,325 |
| Immigrants | Asia | 100.0 /100 | #39 | Exceptional $118,291 |
| Immigrants | Lithuania | 100.0 /100 | #40 | Exceptional $118,053 |
| Estonians | 100.0 /100 | #41 | Exceptional $118,013 |
| Immigrants | Bolivia | 100.0 /100 | #42 | Exceptional $117,912 |
| Bulgarians | 100.0 /100 | #43 | Exceptional $117,818 |
| Cambodians | 100.0 /100 | #44 | Exceptional $117,780 |
| Immigrants | Greece | 99.9 /100 | #45 | Exceptional $117,344 |
| Immigrants | Russia | 99.9 /100 | #46 | Exceptional $116,942 |
| Immigrants | Austria | 99.9 /100 | #47 | Exceptional $116,830 |
| Immigrants | South Africa | 99.9 /100 | #48 | Exceptional $116,286 |
| Chinese | 99.9 /100 | #49 | Exceptional $116,188 |
| Immigrants | Czechoslovakia | 99.9 /100 | #50 | Exceptional $116,165 |
| Immigrants | Malaysia | 99.9 /100 | #51 | Exceptional $115,880 |
Demographics Similar to Immigrants from Nicaragua by Median Family Income
In terms of median family income, the demographic groups most similar to Immigrants from Nicaragua are Potawatomi ($88,265, a difference of 0.0%), Guatemalan ($88,295, a difference of 0.030%), Indonesian ($88,301, a difference of 0.040%), Cherokee ($88,209, a difference of 0.070%), and Bangladeshi ($88,358, a difference of 0.10%).
| Demographics | Rating | Rank | Median Family Income |
| Immigrants | Belize | 0.1 /100 | #279 | Tragic $89,197 |
| British West Indians | 0.1 /100 | #280 | Tragic $88,987 |
| Blackfeet | 0.1 /100 | #281 | Tragic $88,717 |
| Comanche | 0.1 /100 | #282 | Tragic $88,556 |
| Bangladeshis | 0.1 /100 | #283 | Tragic $88,358 |
| Indonesians | 0.1 /100 | #284 | Tragic $88,301 |
| Guatemalans | 0.1 /100 | #285 | Tragic $88,295 |
| Immigrants | Nicaragua | 0.1 /100 | #286 | Tragic $88,267 |
| Potawatomi | 0.1 /100 | #287 | Tragic $88,265 |
| Cherokee | 0.1 /100 | #288 | Tragic $88,209 |
| Central American Indians | 0.1 /100 | #289 | Tragic $88,034 |
| Shoshone | 0.1 /100 | #290 | Tragic $87,872 |
| Immigrants | Cabo Verde | 0.1 /100 | #291 | Tragic $87,830 |
| Africans | 0.1 /100 | #292 | Tragic $87,820 |
| Ute | 0.0 /100 | #293 | Tragic $87,596 |