Cambodian vs Comanche Wage/Income Gap
COMPARE
Cambodian
Comanche
Wage/Income Gap
Wage/Income Gap Comparison
Cambodians
Comanche
25.8%
WAGE/INCOME GAP
45.1/ 100
METRIC RATING
177th/ 347
METRIC RANK
25.0%
WAGE/INCOME GAP
85.2/ 100
METRIC RATING
145th/ 347
METRIC RANK
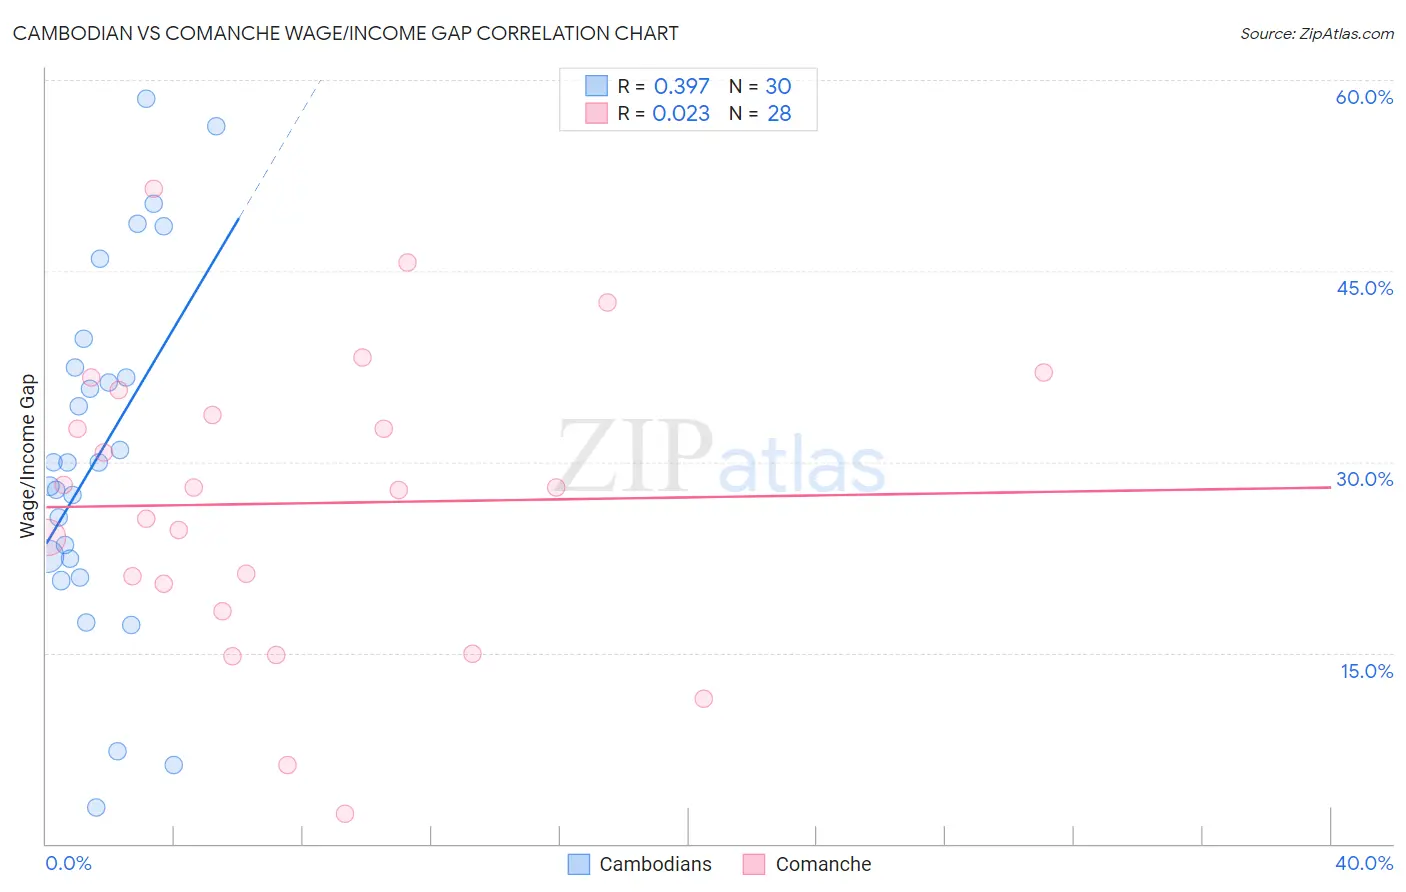
Cambodian vs Comanche Wage/Income Gap Correlation Chart
The statistical analysis conducted on geographies consisting of 102,500,825 people shows a mild positive correlation between the proportion of Cambodians and wage/income gap percentage in the United States with a correlation coefficient (R) of 0.397 and weighted average of 25.8%. Similarly, the statistical analysis conducted on geographies consisting of 109,744,354 people shows no correlation between the proportion of Comanche and wage/income gap percentage in the United States with a correlation coefficient (R) of 0.023 and weighted average of 25.0%, a difference of 3.3%.
Wage/Income Gap Correlation Summary
| Measurement | Cambodian | Comanche |
| Minimum | 2.9% | 2.4% |
| Maximum | 58.5% | 51.5% |
| Range | 55.6% | 49.1% |
| Mean | 30.6% | 26.7% |
| Median | 29.9% | 27.9% |
| Interquartile 25% (IQ1) | 22.4% | 19.4% |
| Interquartile 75% (IQ3) | 37.4% | 34.7% |
| Interquartile Range (IQR) | 15.0% | 15.3% |
| Standard Deviation (Sample) | 13.9% | 11.6% |
| Standard Deviation (Population) | 13.7% | 11.4% |
Similar Demographics by Wage/Income Gap
Demographics Similar to Cambodians by Wage/Income Gap
In terms of wage/income gap, the demographic groups most similar to Cambodians are Paraguayan (25.8%, a difference of 0.11%), Sri Lankan (25.8%, a difference of 0.12%), Chinese (25.9%, a difference of 0.21%), Alaskan Athabascan (25.8%, a difference of 0.32%), and Samoan (26.0%, a difference of 0.44%).
| Demographics | Rating | Rank | Wage/Income Gap |
| Immigrants | Oceania | 57.5 /100 | #170 | Average 25.6% |
| Immigrants | Greece | 56.6 /100 | #171 | Average 25.7% |
| Immigrants | Chile | 53.2 /100 | #172 | Average 25.7% |
| Immigrants | Belarus | 52.9 /100 | #173 | Average 25.7% |
| Alaskan Athabascans | 50.0 /100 | #174 | Average 25.8% |
| Sri Lankans | 47.0 /100 | #175 | Average 25.8% |
| Paraguayans | 46.7 /100 | #176 | Average 25.8% |
| Cambodians | 45.1 /100 | #177 | Average 25.8% |
| Chinese | 42.0 /100 | #178 | Average 25.9% |
| Samoans | 38.6 /100 | #179 | Fair 26.0% |
| Guamanians/Chamorros | 38.0 /100 | #180 | Fair 26.0% |
| Immigrants | Bolivia | 36.4 /100 | #181 | Fair 26.0% |
| Immigrants | Serbia | 35.4 /100 | #182 | Fair 26.0% |
| Immigrants | Kazakhstan | 35.2 /100 | #183 | Fair 26.0% |
| Mexicans | 34.4 /100 | #184 | Fair 26.0% |
Demographics Similar to Comanche by Wage/Income Gap
In terms of wage/income gap, the demographic groups most similar to Comanche are South American (25.0%, a difference of 0.0%), Malaysian (25.0%, a difference of 0.030%), Iroquois (25.1%, a difference of 0.16%), Chippewa (25.0%, a difference of 0.24%), and Immigrants from Peru (25.1%, a difference of 0.31%).
| Demographics | Rating | Rank | Wage/Income Gap |
| Immigrants | Bosnia and Herzegovina | 90.1 /100 | #138 | Exceptional 24.8% |
| Hispanics or Latinos | 89.5 /100 | #139 | Excellent 24.9% |
| Immigrants | Nepal | 89.3 /100 | #140 | Excellent 24.9% |
| Hawaiians | 89.3 /100 | #141 | Excellent 24.9% |
| Afghans | 88.1 /100 | #142 | Excellent 24.9% |
| Immigrants | Uganda | 88.0 /100 | #143 | Excellent 24.9% |
| Chippewa | 86.9 /100 | #144 | Excellent 25.0% |
| Comanche | 85.2 /100 | #145 | Excellent 25.0% |
| South Americans | 85.2 /100 | #146 | Excellent 25.0% |
| Malaysians | 84.9 /100 | #147 | Excellent 25.0% |
| Iroquois | 83.9 /100 | #148 | Excellent 25.1% |
| Immigrants | Peru | 82.6 /100 | #149 | Excellent 25.1% |
| Immigrants | Immigrants | 82.3 /100 | #150 | Excellent 25.1% |
| Taiwanese | 81.6 /100 | #151 | Excellent 25.1% |
| Uruguayans | 81.3 /100 | #152 | Excellent 25.2% |