Cambodian vs Immigrants from Mexico Wage/Income Gap
COMPARE
Cambodian
Immigrants from Mexico
Wage/Income Gap
Wage/Income Gap Comparison
Cambodians
Immigrants from Mexico
25.8%
WAGE/INCOME GAP
45.1/ 100
METRIC RATING
177th/ 347
METRIC RANK
25.3%
WAGE/INCOME GAP
76.4/ 100
METRIC RATING
156th/ 347
METRIC RANK
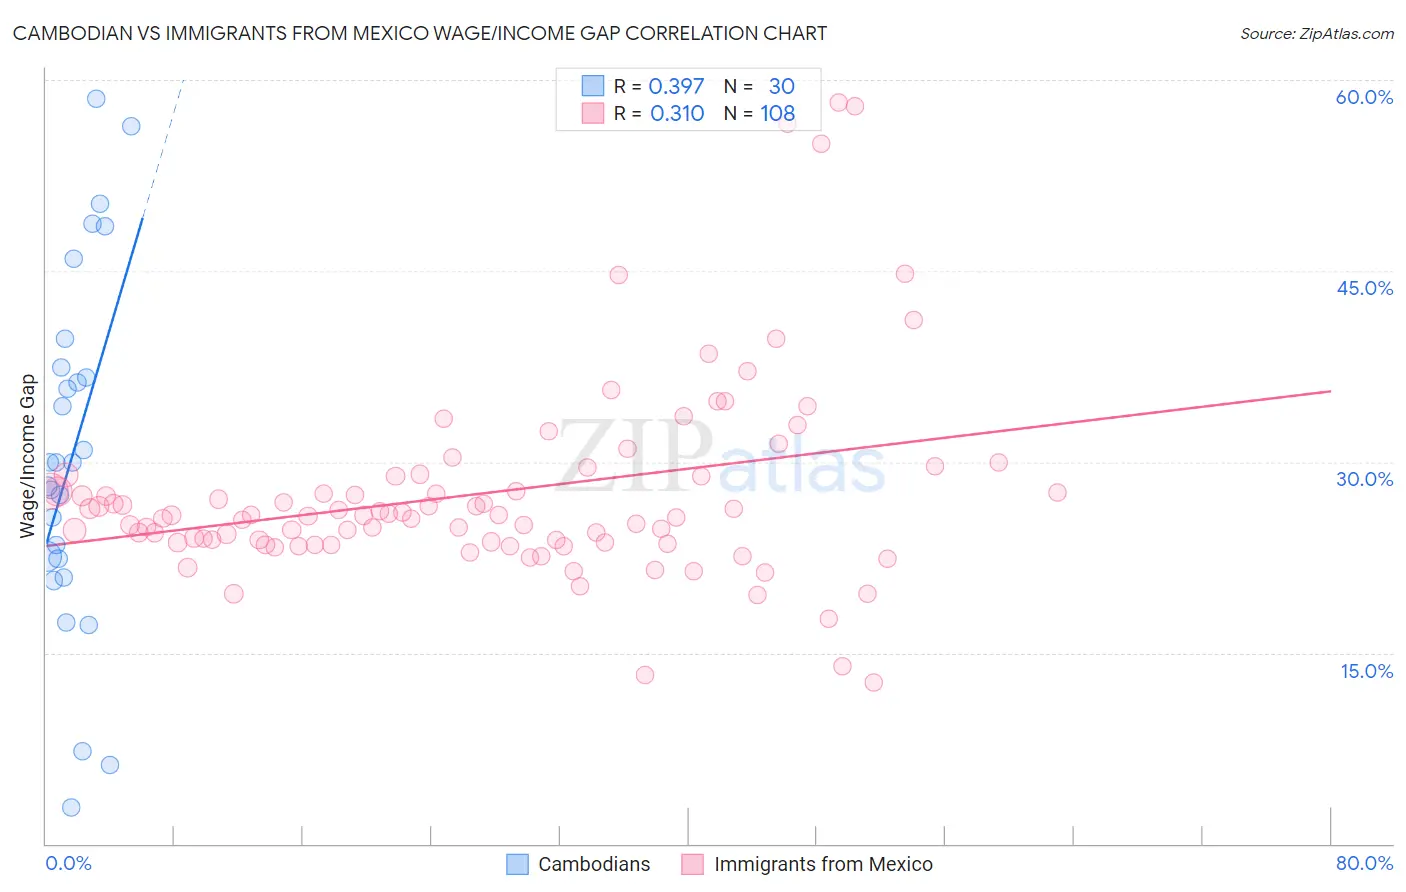
Cambodian vs Immigrants from Mexico Wage/Income Gap Correlation Chart
The statistical analysis conducted on geographies consisting of 102,500,825 people shows a mild positive correlation between the proportion of Cambodians and wage/income gap percentage in the United States with a correlation coefficient (R) of 0.397 and weighted average of 25.8%. Similarly, the statistical analysis conducted on geographies consisting of 512,302,630 people shows a mild positive correlation between the proportion of Immigrants from Mexico and wage/income gap percentage in the United States with a correlation coefficient (R) of 0.310 and weighted average of 25.3%, a difference of 2.3%.
Wage/Income Gap Correlation Summary
| Measurement | Cambodian | Immigrants from Mexico |
| Minimum | 2.9% | 12.7% |
| Maximum | 58.5% | 58.3% |
| Range | 55.6% | 45.6% |
| Mean | 30.6% | 27.5% |
| Median | 29.9% | 25.8% |
| Interquartile 25% (IQ1) | 22.4% | 23.6% |
| Interquartile 75% (IQ3) | 37.4% | 28.9% |
| Interquartile Range (IQR) | 15.0% | 5.3% |
| Standard Deviation (Sample) | 13.9% | 7.9% |
| Standard Deviation (Population) | 13.7% | 7.9% |
Similar Demographics by Wage/Income Gap
Demographics Similar to Cambodians by Wage/Income Gap
In terms of wage/income gap, the demographic groups most similar to Cambodians are Paraguayan (25.8%, a difference of 0.11%), Sri Lankan (25.8%, a difference of 0.12%), Chinese (25.9%, a difference of 0.21%), Alaskan Athabascan (25.8%, a difference of 0.32%), and Samoan (26.0%, a difference of 0.44%).
| Demographics | Rating | Rank | Wage/Income Gap |
| Immigrants | Oceania | 57.5 /100 | #170 | Average 25.6% |
| Immigrants | Greece | 56.6 /100 | #171 | Average 25.7% |
| Immigrants | Chile | 53.2 /100 | #172 | Average 25.7% |
| Immigrants | Belarus | 52.9 /100 | #173 | Average 25.7% |
| Alaskan Athabascans | 50.0 /100 | #174 | Average 25.8% |
| Sri Lankans | 47.0 /100 | #175 | Average 25.8% |
| Paraguayans | 46.7 /100 | #176 | Average 25.8% |
| Cambodians | 45.1 /100 | #177 | Average 25.8% |
| Chinese | 42.0 /100 | #178 | Average 25.9% |
| Samoans | 38.6 /100 | #179 | Fair 26.0% |
| Guamanians/Chamorros | 38.0 /100 | #180 | Fair 26.0% |
| Immigrants | Bolivia | 36.4 /100 | #181 | Fair 26.0% |
| Immigrants | Serbia | 35.4 /100 | #182 | Fair 26.0% |
| Immigrants | Kazakhstan | 35.2 /100 | #183 | Fair 26.0% |
| Mexicans | 34.4 /100 | #184 | Fair 26.0% |
Demographics Similar to Immigrants from Mexico by Wage/Income Gap
In terms of wage/income gap, the demographic groups most similar to Immigrants from Mexico are Costa Rican (25.3%, a difference of 0.060%), Immigrants from Vietnam (25.2%, a difference of 0.12%), Blackfeet (25.2%, a difference of 0.16%), Immigrants from Northern Africa (25.2%, a difference of 0.16%), and Immigrants from Zimbabwe (25.3%, a difference of 0.24%).
| Demographics | Rating | Rank | Wage/Income Gap |
| Immigrants | Peru | 82.6 /100 | #149 | Excellent 25.1% |
| Immigrants | Immigrants | 82.3 /100 | #150 | Excellent 25.1% |
| Taiwanese | 81.6 /100 | #151 | Excellent 25.1% |
| Uruguayans | 81.3 /100 | #152 | Excellent 25.2% |
| Blackfeet | 78.1 /100 | #153 | Good 25.2% |
| Immigrants | Northern Africa | 78.1 /100 | #154 | Good 25.2% |
| Immigrants | Vietnam | 77.7 /100 | #155 | Good 25.2% |
| Immigrants | Mexico | 76.4 /100 | #156 | Good 25.3% |
| Costa Ricans | 75.8 /100 | #157 | Good 25.3% |
| Immigrants | Zimbabwe | 73.7 /100 | #158 | Good 25.3% |
| Puget Sound Salish | 73.0 /100 | #159 | Good 25.3% |
| French American Indians | 72.5 /100 | #160 | Good 25.4% |
| Albanians | 69.4 /100 | #161 | Good 25.4% |
| Shoshone | 69.0 /100 | #162 | Good 25.4% |
| Native Hawaiians | 69.0 /100 | #163 | Good 25.4% |