Bulgarian vs Central American Median Male Earnings
COMPARE
Bulgarian
Central American
Median Male Earnings
Median Male Earnings Comparison
Bulgarians
Central Americans
$62,378
MEDIAN MALE EARNINGS
100.0/ 100
METRIC RATING
45th/ 347
METRIC RANK
$48,093
MEDIAN MALE EARNINGS
0.2/ 100
METRIC RATING
282nd/ 347
METRIC RANK
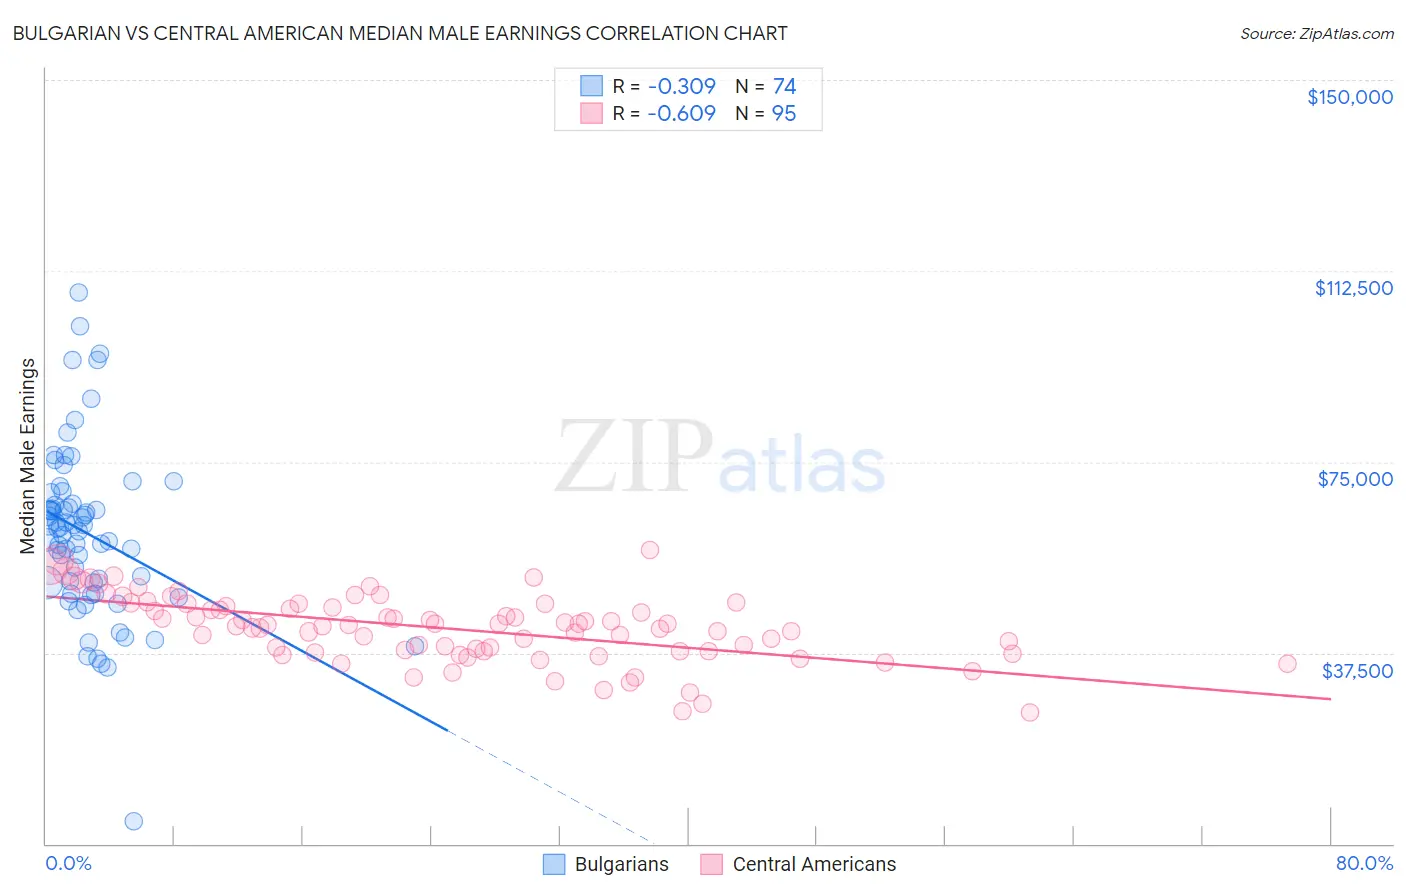
Bulgarian vs Central American Median Male Earnings Correlation Chart
The statistical analysis conducted on geographies consisting of 205,598,511 people shows a mild negative correlation between the proportion of Bulgarians and median male earnings in the United States with a correlation coefficient (R) of -0.309 and weighted average of $62,378. Similarly, the statistical analysis conducted on geographies consisting of 504,312,553 people shows a significant negative correlation between the proportion of Central Americans and median male earnings in the United States with a correlation coefficient (R) of -0.609 and weighted average of $48,093, a difference of 29.7%.
Median Male Earnings Correlation Summary
| Measurement | Bulgarian | Central American |
| Minimum | $4,447 | $25,893 |
| Maximum | $108,199 | $57,715 |
| Range | $103,752 | $31,822 |
| Mean | $60,992 | $42,312 |
| Median | $62,011 | $42,955 |
| Interquartile 25% (IQ1) | $51,254 | $37,781 |
| Interquartile 75% (IQ3) | $66,727 | $47,084 |
| Interquartile Range (IQR) | $15,473 | $9,303 |
| Standard Deviation (Sample) | $16,836 | $6,615 |
| Standard Deviation (Population) | $16,722 | $6,580 |
Similar Demographics by Median Male Earnings
Demographics Similar to Bulgarians by Median Male Earnings
In terms of median male earnings, the demographic groups most similar to Bulgarians are Cambodian ($62,516, a difference of 0.22%), Immigrants from Czechoslovakia ($62,217, a difference of 0.26%), Immigrants from Austria ($62,164, a difference of 0.35%), Immigrants from Malaysia ($62,121, a difference of 0.41%), and Immigrants from Belarus ($62,658, a difference of 0.45%).
| Demographics | Rating | Rank | Median Male Earnings |
| Maltese | 100.0 /100 | #38 | Exceptional $62,953 |
| Immigrants | South Africa | 100.0 /100 | #39 | Exceptional $62,899 |
| Australians | 100.0 /100 | #40 | Exceptional $62,857 |
| Immigrants | Turkey | 100.0 /100 | #41 | Exceptional $62,728 |
| Immigrants | Greece | 100.0 /100 | #42 | Exceptional $62,689 |
| Immigrants | Belarus | 100.0 /100 | #43 | Exceptional $62,658 |
| Cambodians | 100.0 /100 | #44 | Exceptional $62,516 |
| Bulgarians | 100.0 /100 | #45 | Exceptional $62,378 |
| Immigrants | Czechoslovakia | 99.9 /100 | #46 | Exceptional $62,217 |
| Immigrants | Austria | 99.9 /100 | #47 | Exceptional $62,164 |
| Immigrants | Malaysia | 99.9 /100 | #48 | Exceptional $62,121 |
| Immigrants | Europe | 99.9 /100 | #49 | Exceptional $62,057 |
| Bhutanese | 99.9 /100 | #50 | Exceptional $61,759 |
| Estonians | 99.9 /100 | #51 | Exceptional $61,710 |
| Immigrants | Norway | 99.9 /100 | #52 | Exceptional $61,628 |
Demographics Similar to Central Americans by Median Male Earnings
In terms of median male earnings, the demographic groups most similar to Central Americans are Marshallese ($48,137, a difference of 0.090%), Immigrants from Jamaica ($48,040, a difference of 0.11%), African ($47,994, a difference of 0.21%), Paiute ($47,991, a difference of 0.21%), and Mexican American Indian ($47,990, a difference of 0.22%).
| Demographics | Rating | Rank | Median Male Earnings |
| Immigrants | Somalia | 0.3 /100 | #275 | Tragic $48,439 |
| Blackfeet | 0.3 /100 | #276 | Tragic $48,402 |
| Belizeans | 0.2 /100 | #277 | Tragic $48,358 |
| Immigrants | Liberia | 0.2 /100 | #278 | Tragic $48,317 |
| Hmong | 0.2 /100 | #279 | Tragic $48,254 |
| Comanche | 0.2 /100 | #280 | Tragic $48,202 |
| Marshallese | 0.2 /100 | #281 | Tragic $48,137 |
| Central Americans | 0.2 /100 | #282 | Tragic $48,093 |
| Immigrants | Jamaica | 0.2 /100 | #283 | Tragic $48,040 |
| Africans | 0.2 /100 | #284 | Tragic $47,994 |
| Paiute | 0.2 /100 | #285 | Tragic $47,991 |
| Mexican American Indians | 0.2 /100 | #286 | Tragic $47,990 |
| Immigrants | El Salvador | 0.2 /100 | #287 | Tragic $47,973 |
| Shoshone | 0.2 /100 | #288 | Tragic $47,930 |
| Chickasaw | 0.1 /100 | #289 | Tragic $47,832 |