Brazilian vs Lebanese Per Capita Income
COMPARE
Brazilian
Lebanese
Per Capita Income
Per Capita Income Comparison
Brazilians
Lebanese
$46,700
PER CAPITA INCOME
96.8/ 100
METRIC RATING
104th/ 347
METRIC RANK
$45,840
PER CAPITA INCOME
92.0/ 100
METRIC RATING
123rd/ 347
METRIC RANK
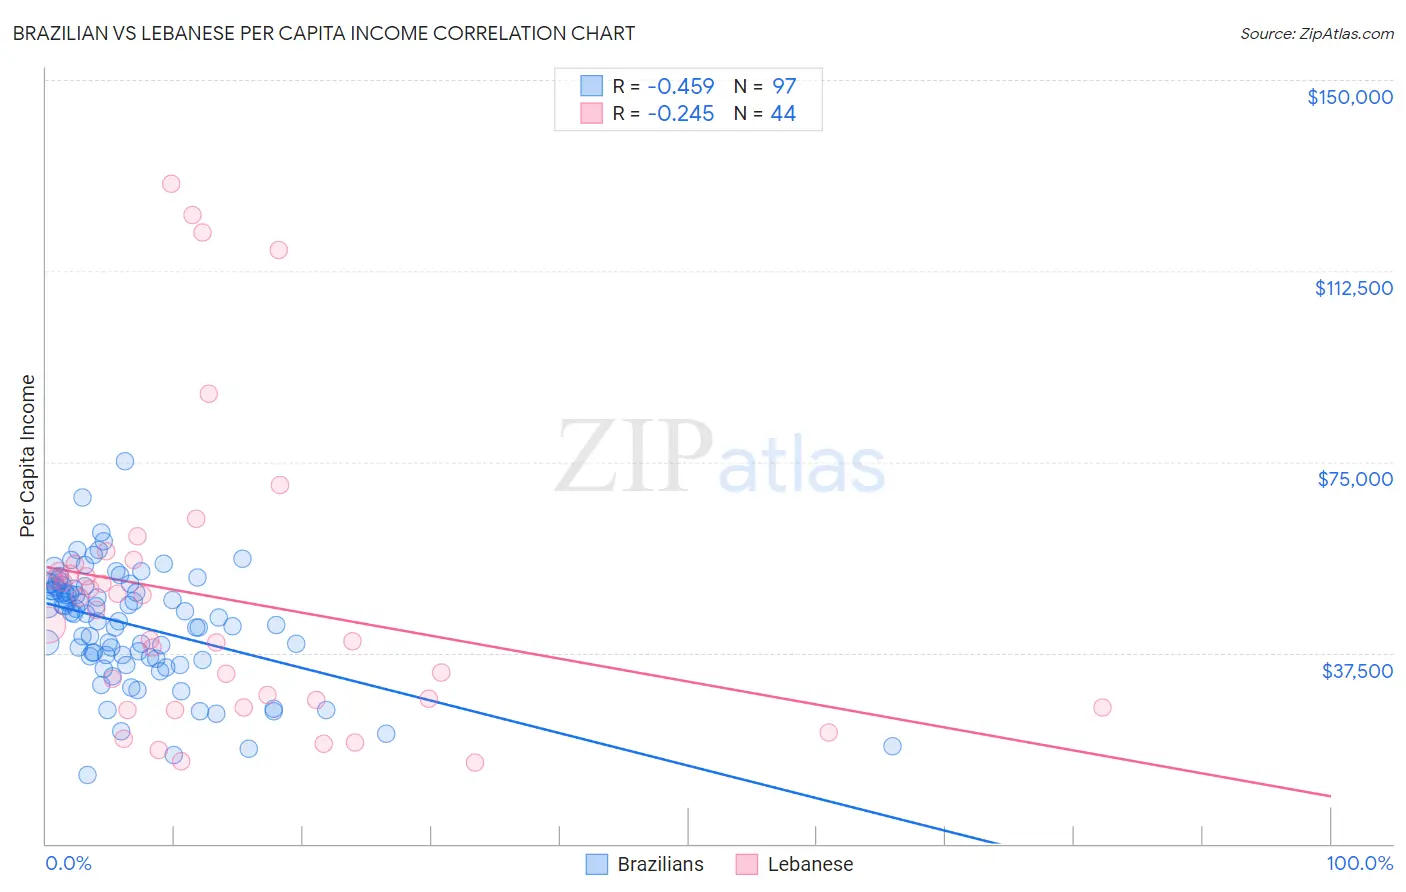
Brazilian vs Lebanese Per Capita Income Correlation Chart
The statistical analysis conducted on geographies consisting of 323,990,504 people shows a moderate negative correlation between the proportion of Brazilians and per capita income in the United States with a correlation coefficient (R) of -0.459 and weighted average of $46,700. Similarly, the statistical analysis conducted on geographies consisting of 401,645,404 people shows a weak negative correlation between the proportion of Lebanese and per capita income in the United States with a correlation coefficient (R) of -0.245 and weighted average of $45,840, a difference of 1.9%.
Per Capita Income Correlation Summary
| Measurement | Brazilian | Lebanese |
| Minimum | $13,624 | $15,839 |
| Maximum | $75,068 | $129,581 |
| Range | $61,444 | $113,742 |
| Mean | $42,865 | $48,201 |
| Median | $45,205 | $44,395 |
| Interquartile 25% (IQ1) | $36,434 | $27,415 |
| Interquartile 75% (IQ3) | $50,401 | $54,286 |
| Interquartile Range (IQR) | $13,966 | $26,871 |
| Standard Deviation (Sample) | $11,177 | $28,531 |
| Standard Deviation (Population) | $11,120 | $28,205 |
Demographics Similar to Brazilians and Lebanese by Per Capita Income
In terms of per capita income, the demographic groups most similar to Brazilians are British ($46,571, a difference of 0.28%), Ethiopian ($46,569, a difference of 0.28%), Syrian ($46,837, a difference of 0.29%), Serbian ($46,551, a difference of 0.32%), and Immigrants from Kuwait ($46,543, a difference of 0.34%). Similarly, the demographic groups most similar to Lebanese are Moroccan ($45,854, a difference of 0.030%), Canadian ($45,858, a difference of 0.040%), Immigrants from Ethiopia ($45,923, a difference of 0.18%), Immigrants from Poland ($45,979, a difference of 0.30%), and Immigrants from Saudi Arabia ($46,008, a difference of 0.37%).
| Demographics | Rating | Rank | Per Capita Income |
| Syrians | 97.2 /100 | #103 | Exceptional $46,837 |
| Brazilians | 96.8 /100 | #104 | Exceptional $46,700 |
| British | 96.3 /100 | #105 | Exceptional $46,571 |
| Ethiopians | 96.3 /100 | #106 | Exceptional $46,569 |
| Serbians | 96.2 /100 | #107 | Exceptional $46,551 |
| Immigrants | Kuwait | 96.2 /100 | #108 | Exceptional $46,543 |
| Immigrants | Northern Africa | 96.2 /100 | #109 | Exceptional $46,531 |
| Chileans | 95.9 /100 | #110 | Exceptional $46,459 |
| Taiwanese | 95.8 /100 | #111 | Exceptional $46,455 |
| Immigrants | Morocco | 95.7 /100 | #112 | Exceptional $46,430 |
| Immigrants | Albania | 95.5 /100 | #113 | Exceptional $46,387 |
| Afghans | 94.9 /100 | #114 | Exceptional $46,268 |
| Immigrants | Chile | 94.6 /100 | #115 | Exceptional $46,213 |
| Poles | 94.1 /100 | #116 | Exceptional $46,123 |
| Chinese | 93.9 /100 | #117 | Exceptional $46,098 |
| Immigrants | Saudi Arabia | 93.3 /100 | #118 | Exceptional $46,008 |
| Immigrants | Poland | 93.1 /100 | #119 | Exceptional $45,979 |
| Immigrants | Ethiopia | 92.7 /100 | #120 | Exceptional $45,923 |
| Canadians | 92.2 /100 | #121 | Exceptional $45,858 |
| Moroccans | 92.1 /100 | #122 | Exceptional $45,854 |
| Lebanese | 92.0 /100 | #123 | Exceptional $45,840 |