Brazilian vs Nonimmigrants Per Capita Income

COMPARE

Brazilian
Race
Ancestry
AfghanAfricanAlaska NativeAlaskan AthabascanAlbanianAleutAlsatianAmericanApacheArabArapahoArgentineanArmenianAssyrian/Chaldean/SyriacAustralianAustrianBahamianBangladeshiBarbadianBasqueBelgianBelizeanBermudanBhutaneseBlackfeetBolivianBrazilianBritishBritish West IndianBulgarianBurmeseCajunCambodianCanadianCape VerdeanCarpatho RusynCelticCentral AmericanCentral American IndianCherokeeCheyenneChickasawChileanChineseChippewaChoctawColombianColvilleComancheCosta RicanCreeCreekCroatianCrowCubanCypriotCzechCzechoslovakianDanishDelawareDominicanDutchDutch West IndianEastern EuropeanEcuadorianEgyptianEnglishEstonianEthiopianEuropeanFijianFilipinoFinnishFrenchFrench American IndianFrench CanadianGermanGerman RussianGhanaianGreekGuamanian/ChamorroGuatemalanGuyaneseHaitianHmongHonduranHopiHoumaHungarianIcelanderIndian (Asian)IndonesianInupiatIranianIraqiIrishIroquoisIsraeliItalianJamaicanJapaneseJordanianKenyanKiowaKoreanLaotianLatvianLebaneseLiberianLithuanianLumbeeLuxembourgerMacedonianMalaysianMalteseMarshalleseMenomineeMexicanMexican American IndianMongolianMoroccanNative HawaiianNavajoNepaleseNew ZealanderNicaraguanNigerianNorthern EuropeanNorwegianOkinawanOsageOttawaPaiutePakistaniPalestinianPanamanianParaguayanPennsylvania GermanPeruvianPimaPolishPortuguesePotawatomiPuebloPuerto RicanPuget Sound SalishRomanianRussianSalvadoranSamoanScandinavianScotch-IrishScottishSeminoleSenegaleseSerbianShoshoneSierra LeoneanSiouxSlavicSlovakSloveneSomaliSouth AfricanSouth AmericanSouth American IndianSoviet UnionSpaniardSpanishSpanish AmericanSpanish American IndianSri LankanSubsaharan AfricanSudaneseSwedishSwissSyrianTaiwaneseThaiTlingit-HaidaTohono O'OdhamTonganTrinidadian and TobagonianTsimshianTurkishU.S. Virgin IslanderUgandanUkrainianUruguayanUteVenezuelanVietnameseWelshWest IndianYakamaYaquiYugoslavianYumanYup'ikZimbabwean
Immigration
ImmigrantsAfghanistanAfricaAlbaniaArgentinaArmeniaAsiaAustraliaAustriaBahamasBangladeshBarbadosBelarusBelgiumBelizeBoliviaBosnia and HerzegovinaBrazilBulgariaBurma/MyanmarCabo VerdeCambodiaCameroonCanadaCaribbeanCentral AmericaChileChinaColombiaCongoCosta RicaCroatiaCubaCzechoslovakiaDenmarkDominicaDominican RepublicEastern AfricaEastern AsiaEastern EuropeEcuadorEgyptEl SalvadorEnglandEritreaEthiopiaEuropeFijiFranceGermanyGhanaGreeceGrenadaGuatemalaGuyanaHaitiHondurasHong KongHungaryIndiaIndonesiaIranIraqIrelandIsraelItalyJamaicaJapanJordanKazakhstanKenyaKoreaKuwaitLaosLatin AmericaLatviaLebanonLiberiaLithuaniaMalaysiaMexicoMicronesiaMiddle AfricaMoldovaMoroccoNepalNetherlandsNicaraguaNigeriaNorth AmericaNorth MacedoniaNorthern AfricaNorthern EuropeNorwayOceaniaPakistanPanamaPeruPhilippinesPolandPortugalRomaniaRussiaSaudi ArabiaScotlandSenegalSerbiaSierra LeoneSingaporeSomaliaSouth AfricaSouth AmericaSouth Central AsiaSouth Eastern AsiaSouthern EuropeSpainSri LankaSt. Vincent and the GrenadinesSudanSwedenSwitzerlandSyriaTaiwanThailandTrinidad and TobagoTurkeyUgandaUkraineUruguayUzbekistanVenezuelaVietnamWest IndiesWestern AfricaWestern AsiaWestern EuropeYemenZaireZimbabweAzores
Nonimmigrants
Race
Ancestry
AfghanAfricanAlaska NativeAlaskan AthabascanAlbanianAleutAlsatianAmericanApacheArabArapahoArgentineanArmenianAssyrian/Chaldean/SyriacAustralianAustrianBahamianBangladeshiBarbadianBasqueBelgianBelizeanBermudanBhutaneseBlackfeetBolivianBritishBritish West IndianBulgarianBurmeseCajunCambodianCanadianCape VerdeanCarpatho RusynCelticCentral AmericanCentral American IndianCherokeeCheyenneChickasawChileanChineseChippewaChoctawColombianColvilleComancheCosta RicanCreeCreekCroatianCrowCubanCypriotCzechCzechoslovakianDanishDelawareDominicanDutchDutch West IndianEastern EuropeanEcuadorianEgyptianEnglishEstonianEthiopianEuropeanFijianFilipinoFinnishFrenchFrench American IndianFrench CanadianGermanGerman RussianGhanaianGreekGuamanian/ChamorroGuatemalanGuyaneseHaitianHmongHonduranHopiHoumaHungarianIcelanderIndian (Asian)IndonesianInupiatIranianIraqiIrishIroquoisIsraeliItalianJamaicanJapaneseJordanianKenyanKiowaKoreanLaotianLatvianLebaneseLiberianLithuanianLumbeeLuxembourgerMacedonianMalaysianMalteseMarshalleseMenomineeMexicanMexican American IndianMongolianMoroccanNative HawaiianNavajoNepaleseNew ZealanderNicaraguanNigerianNorthern EuropeanNorwegianOkinawanOsageOttawaPaiutePakistaniPalestinianPanamanianParaguayanPennsylvania GermanPeruvianPimaPolishPortuguesePotawatomiPuebloPuerto RicanPuget Sound SalishRomanianRussianSalvadoranSamoanScandinavianScotch-IrishScottishSeminoleSenegaleseSerbianShoshoneSierra LeoneanSiouxSlavicSlovakSloveneSomaliSouth AfricanSouth AmericanSouth American IndianSoviet UnionSpaniardSpanishSpanish AmericanSpanish American IndianSri LankanSubsaharan AfricanSudaneseSwedishSwissSyrianTaiwaneseThaiTlingit-HaidaTohono O'OdhamTonganTrinidadian and TobagonianTsimshianTurkishU.S. Virgin IslanderUgandanUkrainianUruguayanUteVenezuelanVietnameseWelshWest IndianYakamaYaquiYugoslavianYumanYup'ikZimbabwean
Immigration
NonimmigrantsImmigrantsAfghanistanAfricaAlbaniaArgentinaArmeniaAsiaAustraliaAustriaBahamasBangladeshBarbadosBelarusBelgiumBelizeBoliviaBosnia and HerzegovinaBrazilBulgariaBurma/MyanmarCabo VerdeCambodiaCameroonCanadaCaribbeanCentral AmericaChileChinaColombiaCongoCosta RicaCroatiaCubaCzechoslovakiaDenmarkDominicaDominican RepublicEastern AfricaEastern AsiaEastern EuropeEcuadorEgyptEl SalvadorEnglandEritreaEthiopiaEuropeFijiFranceGermanyGhanaGreeceGrenadaGuatemalaGuyanaHaitiHondurasHong KongHungaryIndiaIndonesiaIranIraqIrelandIsraelItalyJamaicaJapanJordanKazakhstanKenyaKoreaKuwaitLaosLatin AmericaLatviaLebanonLiberiaLithuaniaMalaysiaMexicoMicronesiaMiddle AfricaMoldovaMoroccoNepalNetherlandsNicaraguaNigeriaNorth AmericaNorth MacedoniaNorthern AfricaNorthern EuropeNorwayOceaniaPakistanPanamaPeruPhilippinesPolandPortugalRomaniaRussiaSaudi ArabiaScotlandSenegalSerbiaSierra LeoneSingaporeSomaliaSouth AfricaSouth AmericaSouth Central AsiaSouth Eastern AsiaSouthern EuropeSpainSri LankaSt. Vincent and the GrenadinesSudanSwedenSwitzerlandSyriaTaiwanThailandTrinidad and TobagoTurkeyUgandaUkraineUruguayUzbekistanVenezuelaVietnamWest IndiesWestern AfricaWestern AsiaWestern EuropeYemenZaireZimbabweAzores
Per Capita Income
Income
Poverty
Unemployment
Labor Participation
Family Structure
Vehicle Availability
Education Level
Disability

Per Capita Income Comparison

Brazilians

Nonimmigrants

Exceptional
Tragic
$46,700
PER CAPITA INCOME
96.8/ 100
METRIC RATING
104th/ 347
METRIC RANK
$40,669
PER CAPITA INCOME
3.4/ 100
METRIC RATING
236th/ 347
METRIC RANK

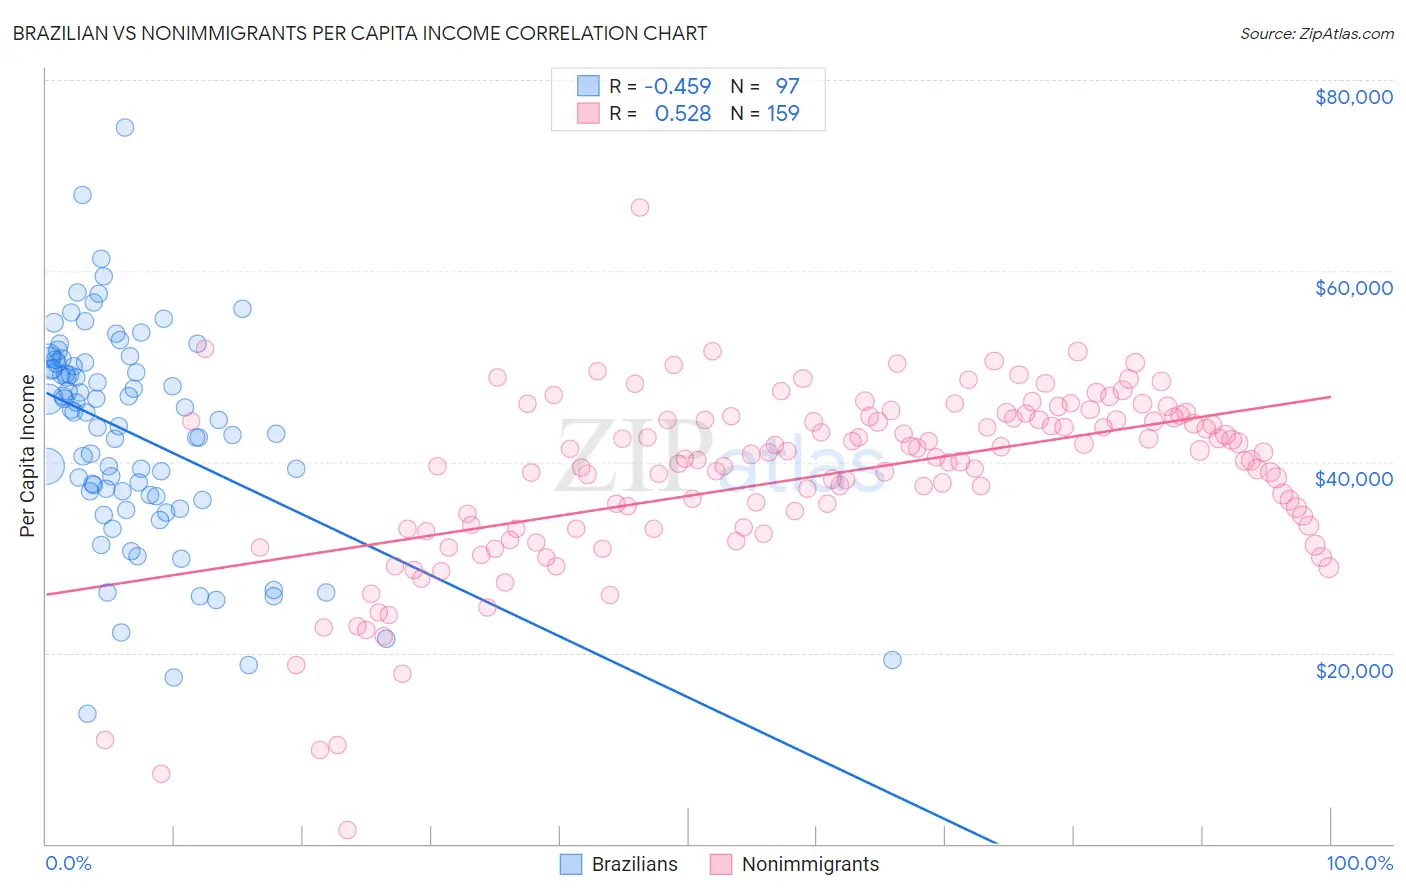
Brazilian vs Nonimmigrants Per Capita Income Correlation Chart

The statistical analysis conducted on geographies consisting of 323,990,504 people shows a moderate negative correlation between the proportion of Brazilians and per capita income in the United States with a correlation coefficient (R) of -0.459 and weighted average of $46,700. Similarly, the statistical analysis conducted on geographies consisting of 585,383,873 people shows a substantial positive correlation between the proportion of Nonimmigrants and per capita income in the United States with a correlation coefficient (R) of 0.528 and weighted average of $40,669, a difference of 14.8%.
Brazilian vs Nonimmigrants Per Capita Income

Per Capita Income Correlation Summary

MeasurementBrazilianNonimmigrants
Minimum$13,624$1,397
Maximum$75,068$66,659
Range$61,444$65,262
Mean$42,865$38,443
Median$45,205$40,388
Interquartile 25% (IQ1)$36,434$33,053
Interquartile 75% (IQ3)$50,401$44,574
Interquartile Range (IQR)$13,966$11,521
Standard Deviation (Sample)$11,177$9,433
Standard Deviation (Population)$11,120$9,403

Similar Demographics by Per Capita Income

Demographics Similar to Brazilians by Per Capita Income

In terms of per capita income, the demographic groups most similar to Brazilians are British ($46,571, a difference of 0.28%), Ethiopian ($46,569, a difference of 0.28%), Syrian ($46,837, a difference of 0.29%), Serbian ($46,551, a difference of 0.32%), and Immigrants from Kuwait ($46,543, a difference of 0.34%).
DemographicsRating | RankPer Capita Income
Carpatho Rusyns
98.2
/100
|
#97
Exceptional
$47,248
Immigrants | Pakistan
97.9
/100
|
#98
Exceptional
$47,084
Laotians
97.8
/100
|
#99
Exceptional
$47,041
Immigrants | Lebanon
97.5
/100
|
#100
Exceptional
$46,938
Immigrants | Uzbekistan
97.5
/100
|
#101
Exceptional
$46,929
Immigrants | Western Asia
97.4
/100
|
#102
Exceptional
$46,876
Syrians
97.2
/100
|
#103
Exceptional
$46,837
Brazilians
96.8
/100
|
#104
Exceptional
$46,700
British
96.3
/100
|
#105
Exceptional
$46,571
Ethiopians
96.3
/100
|
#106
Exceptional
$46,569
Serbians
96.2
/100
|
#107
Exceptional
$46,551
Immigrants | Kuwait
96.2
/100
|
#108
Exceptional
$46,543
Immigrants | Northern Africa
96.2
/100
|
#109
Exceptional
$46,531
Chileans
95.9
/100
|
#110
Exceptional
$46,459
Taiwanese
95.8
/100
|
#111
Exceptional
$46,455

Demographics Similar to Nonimmigrants by Per Capita Income

In terms of per capita income, the demographic groups most similar to Nonimmigrants are Immigrants from Guyana ($40,742, a difference of 0.18%), Immigrants from West Indies ($40,763, a difference of 0.23%), Delaware ($40,778, a difference of 0.27%), Immigrants from Cambodia ($40,434, a difference of 0.58%), and Guyanese ($40,949, a difference of 0.69%).
DemographicsRating | RankPer Capita Income
Nigerians
4.9
/100
|
#229
Tragic
$41,026
Native Hawaiians
4.9
/100
|
#230
Tragic
$41,017
Senegalese
4.8
/100
|
#231
Tragic
$41,000
Guyanese
4.5
/100
|
#232
Tragic
$40,949
Delaware
3.8
/100
|
#233
Tragic
$40,778
Immigrants | West Indies
3.7
/100
|
#234
Tragic
$40,763
Immigrants | Guyana
3.6
/100
|
#235
Tragic
$40,742
Immigrants | Nonimmigrants
3.4
/100
|
#236
Tragic
$40,669
Immigrants | Cambodia
2.6
/100
|
#237
Tragic
$40,434
Somalis
2.4
/100
|
#238
Tragic
$40,367
Tsimshian
2.4
/100
|
#239
Tragic
$40,344
Immigrants | Nigeria
2.3
/100
|
#240
Tragic
$40,339
British West Indians
2.3
/100
|
#241
Tragic
$40,330
Immigrants | Western Africa
2.2
/100
|
#242
Tragic
$40,294
German Russians
2.2
/100
|
#243
Tragic
$40,266