Black/African American vs Egyptian Median Household Income
COMPARE
Black/African American
Egyptian
Median Household Income
Median Household Income Comparison
Blacks/African Americans
Egyptians
$67,573
MEDIAN HOUSEHOLD INCOME
0.0/ 100
METRIC RATING
334th/ 347
METRIC RANK
$95,673
MEDIAN HOUSEHOLD INCOME
99.9/ 100
METRIC RATING
54th/ 347
METRIC RANK
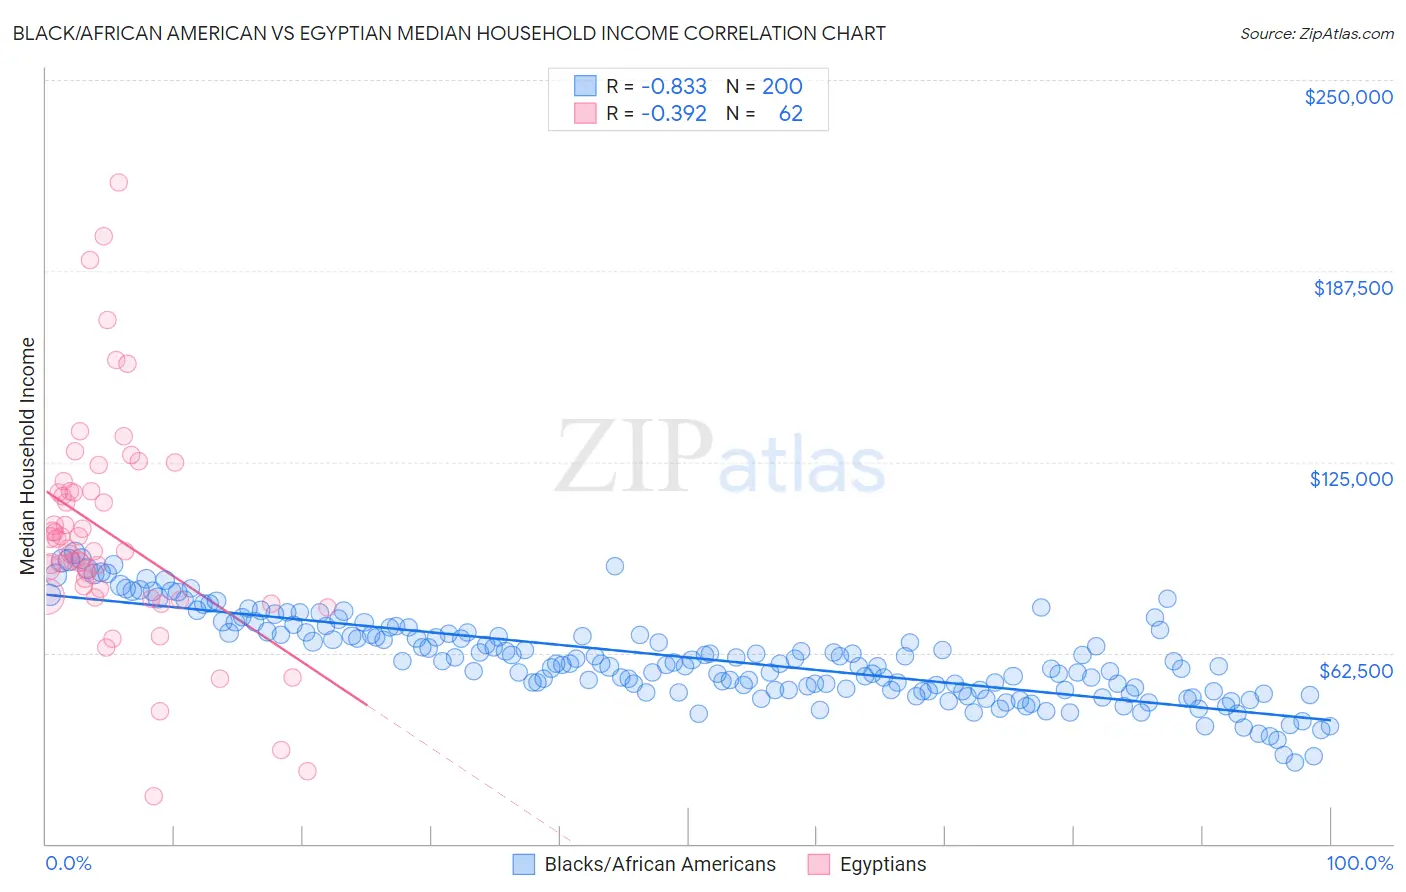
Black/African American vs Egyptian Median Household Income Correlation Chart
The statistical analysis conducted on geographies consisting of 564,831,998 people shows a very strong negative correlation between the proportion of Blacks/African Americans and median household income in the United States with a correlation coefficient (R) of -0.833 and weighted average of $67,573. Similarly, the statistical analysis conducted on geographies consisting of 276,717,695 people shows a mild negative correlation between the proportion of Egyptians and median household income in the United States with a correlation coefficient (R) of -0.392 and weighted average of $95,673, a difference of 41.6%.
Median Household Income Correlation Summary
| Measurement | Black/African American | Egyptian |
| Minimum | $26,476 | $15,682 |
| Maximum | $95,304 | $216,495 |
| Range | $68,828 | $200,813 |
| Mean | $60,966 | $100,993 |
| Median | $59,295 | $96,117 |
| Interquartile 25% (IQ1) | $50,395 | $81,164 |
| Interquartile 75% (IQ3) | $69,686 | $115,184 |
| Interquartile Range (IQR) | $19,291 | $34,020 |
| Standard Deviation (Sample) | $14,297 | $37,055 |
| Standard Deviation (Population) | $14,261 | $36,755 |
Similar Demographics by Median Household Income
Demographics Similar to Blacks/African Americans by Median Household Income
In terms of median household income, the demographic groups most similar to Blacks/African Americans are Creek ($67,715, a difference of 0.21%), Sioux ($67,792, a difference of 0.32%), Native/Alaskan ($67,879, a difference of 0.45%), Arapaho ($67,965, a difference of 0.58%), and Cheyenne ($66,974, a difference of 0.89%).
| Demographics | Rating | Rank | Median Household Income |
| Immigrants | Cuba | 0.0 /100 | #327 | Tragic $68,461 |
| Menominee | 0.0 /100 | #328 | Tragic $68,423 |
| Dutch West Indians | 0.0 /100 | #329 | Tragic $68,412 |
| Arapaho | 0.0 /100 | #330 | Tragic $67,965 |
| Natives/Alaskans | 0.0 /100 | #331 | Tragic $67,879 |
| Sioux | 0.0 /100 | #332 | Tragic $67,792 |
| Creek | 0.0 /100 | #333 | Tragic $67,715 |
| Blacks/African Americans | 0.0 /100 | #334 | Tragic $67,573 |
| Cheyenne | 0.0 /100 | #335 | Tragic $66,974 |
| Immigrants | Congo | 0.0 /100 | #336 | Tragic $66,768 |
| Kiowa | 0.0 /100 | #337 | Tragic $65,914 |
| Immigrants | Yemen | 0.0 /100 | #338 | Tragic $65,194 |
| Hopi | 0.0 /100 | #339 | Tragic $65,043 |
| Pueblo | 0.0 /100 | #340 | Tragic $64,692 |
| Crow | 0.0 /100 | #341 | Tragic $63,681 |
Demographics Similar to Egyptians by Median Household Income
In terms of median household income, the demographic groups most similar to Egyptians are Paraguayan ($95,737, a difference of 0.070%), Immigrants from South Africa ($95,800, a difference of 0.13%), Estonian ($95,930, a difference of 0.27%), Immigrants from Czechoslovakia ($95,319, a difference of 0.37%), and Immigrants from Austria ($95,277, a difference of 0.42%).
| Demographics | Rating | Rank | Median Household Income |
| Immigrants | Russia | 99.9 /100 | #47 | Exceptional $96,378 |
| Cambodians | 99.9 /100 | #48 | Exceptional $96,324 |
| Immigrants | Malaysia | 99.9 /100 | #49 | Exceptional $96,292 |
| Bulgarians | 99.9 /100 | #50 | Exceptional $96,290 |
| Estonians | 99.9 /100 | #51 | Exceptional $95,930 |
| Immigrants | South Africa | 99.9 /100 | #52 | Exceptional $95,800 |
| Paraguayans | 99.9 /100 | #53 | Exceptional $95,737 |
| Egyptians | 99.9 /100 | #54 | Exceptional $95,673 |
| Immigrants | Czechoslovakia | 99.9 /100 | #55 | Exceptional $95,319 |
| Immigrants | Austria | 99.9 /100 | #56 | Exceptional $95,277 |
| New Zealanders | 99.8 /100 | #57 | Exceptional $95,146 |
| Soviet Union | 99.8 /100 | #58 | Exceptional $95,098 |
| Immigrants | Europe | 99.8 /100 | #59 | Exceptional $95,032 |
| Koreans | 99.8 /100 | #60 | Exceptional $95,018 |
| Laotians | 99.8 /100 | #61 | Exceptional $94,990 |