Black/African American vs Immigrants from Sweden Per Capita Income
COMPARE
Black/African American
Immigrants from Sweden
Per Capita Income
Per Capita Income Comparison
Blacks/African Americans
Immigrants from Sweden
$35,564
PER CAPITA INCOME
0.0/ 100
METRIC RATING
321st/ 347
METRIC RANK
$55,582
PER CAPITA INCOME
100.0/ 100
METRIC RATING
12th/ 347
METRIC RANK
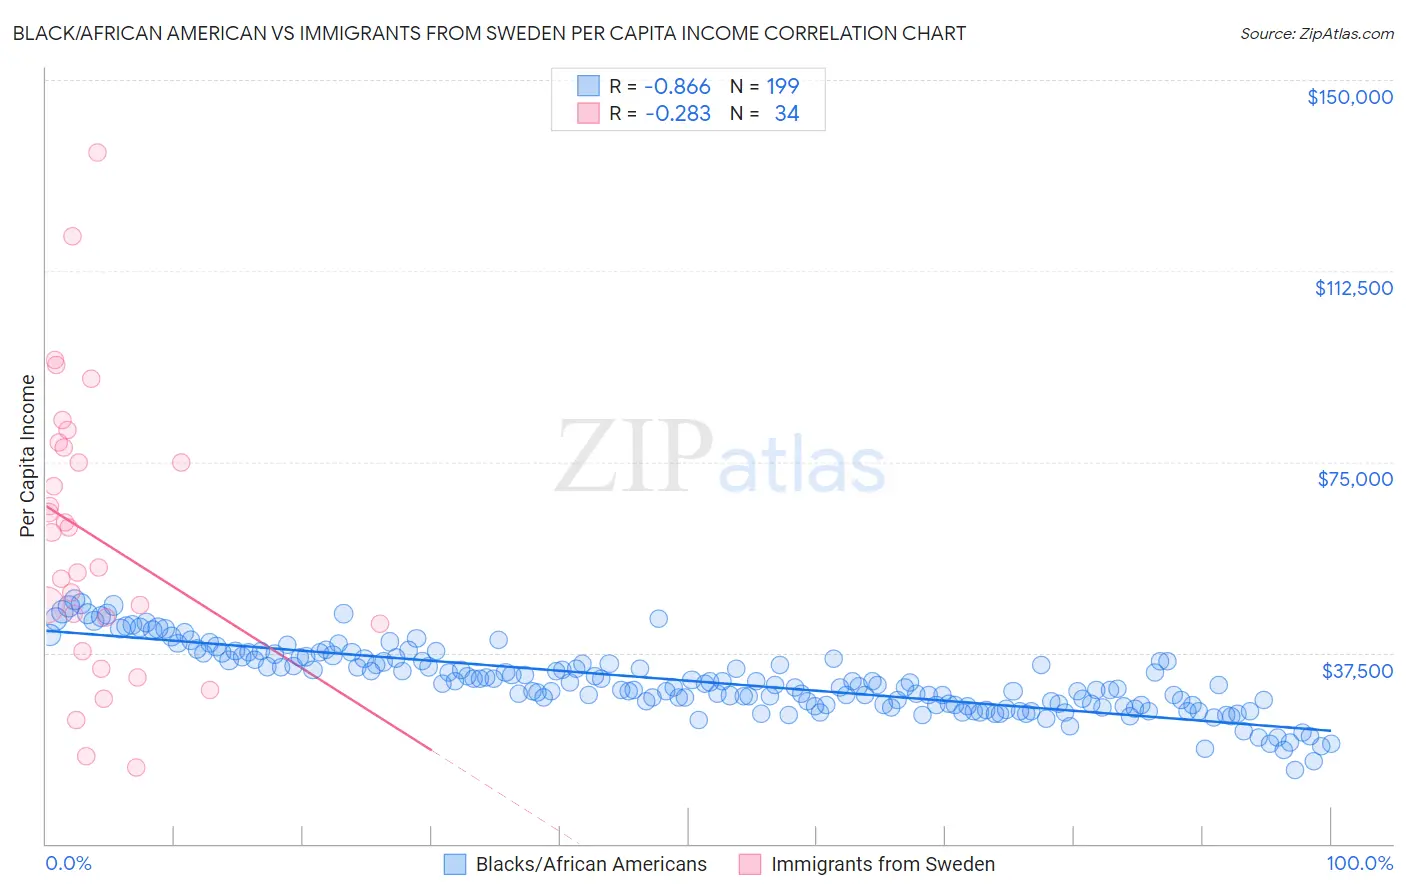
Black/African American vs Immigrants from Sweden Per Capita Income Correlation Chart
The statistical analysis conducted on geographies consisting of 564,923,865 people shows a very strong negative correlation between the proportion of Blacks/African Americans and per capita income in the United States with a correlation coefficient (R) of -0.866 and weighted average of $35,564. Similarly, the statistical analysis conducted on geographies consisting of 164,749,853 people shows a weak negative correlation between the proportion of Immigrants from Sweden and per capita income in the United States with a correlation coefficient (R) of -0.283 and weighted average of $55,582, a difference of 56.3%.
Per Capita Income Correlation Summary
| Measurement | Black/African American | Immigrants from Sweden |
| Minimum | $14,598 | $15,015 |
| Maximum | $47,964 | $135,828 |
| Range | $33,366 | $120,813 |
| Mean | $32,008 | $60,294 |
| Median | $31,154 | $57,777 |
| Interquartile 25% (IQ1) | $27,216 | $43,188 |
| Interquartile 75% (IQ3) | $36,450 | $77,916 |
| Interquartile Range (IQR) | $9,234 | $34,728 |
| Standard Deviation (Sample) | $6,581 | $27,626 |
| Standard Deviation (Population) | $6,564 | $27,217 |
Similar Demographics by Per Capita Income
Demographics Similar to Blacks/African Americans by Per Capita Income
In terms of per capita income, the demographic groups most similar to Blacks/African Americans are Creek ($35,546, a difference of 0.050%), Hispanic or Latino ($35,688, a difference of 0.35%), Immigrants from Congo ($35,720, a difference of 0.44%), Cheyenne ($35,276, a difference of 0.82%), and Bangladeshi ($35,897, a difference of 0.94%).
| Demographics | Rating | Rank | Per Capita Income |
| Seminole | 0.0 /100 | #314 | Tragic $36,180 |
| Yaqui | 0.0 /100 | #315 | Tragic $36,112 |
| Choctaw | 0.0 /100 | #316 | Tragic $35,999 |
| Dutch West Indians | 0.0 /100 | #317 | Tragic $35,922 |
| Bangladeshis | 0.0 /100 | #318 | Tragic $35,897 |
| Immigrants | Congo | 0.0 /100 | #319 | Tragic $35,720 |
| Hispanics or Latinos | 0.0 /100 | #320 | Tragic $35,688 |
| Blacks/African Americans | 0.0 /100 | #321 | Tragic $35,564 |
| Creek | 0.0 /100 | #322 | Tragic $35,546 |
| Cheyenne | 0.0 /100 | #323 | Tragic $35,276 |
| Kiowa | 0.0 /100 | #324 | Tragic $35,102 |
| Immigrants | Central America | 0.0 /100 | #325 | Tragic $34,974 |
| Immigrants | Cuba | 0.0 /100 | #326 | Tragic $34,910 |
| Apache | 0.0 /100 | #327 | Tragic $34,886 |
| Menominee | 0.0 /100 | #328 | Tragic $34,578 |
Demographics Similar to Immigrants from Sweden by Per Capita Income
In terms of per capita income, the demographic groups most similar to Immigrants from Sweden are Eastern European ($55,780, a difference of 0.36%), Okinawan ($55,817, a difference of 0.42%), Immigrants from India ($55,268, a difference of 0.57%), Immigrants from Belgium ($55,082, a difference of 0.91%), and Cypriot ($54,899, a difference of 1.2%).
| Demographics | Rating | Rank | Per Capita Income |
| Immigrants | Iran | 100.0 /100 | #5 | Exceptional $57,759 |
| Immigrants | Taiwan | 100.0 /100 | #6 | Exceptional $57,742 |
| Immigrants | Israel | 100.0 /100 | #7 | Exceptional $57,384 |
| Immigrants | Hong Kong | 100.0 /100 | #8 | Exceptional $56,709 |
| Immigrants | Ireland | 100.0 /100 | #9 | Exceptional $56,584 |
| Okinawans | 100.0 /100 | #10 | Exceptional $55,817 |
| Eastern Europeans | 100.0 /100 | #11 | Exceptional $55,780 |
| Immigrants | Sweden | 100.0 /100 | #12 | Exceptional $55,582 |
| Immigrants | India | 100.0 /100 | #13 | Exceptional $55,268 |
| Immigrants | Belgium | 100.0 /100 | #14 | Exceptional $55,082 |
| Cypriots | 100.0 /100 | #15 | Exceptional $54,899 |
| Immigrants | Switzerland | 100.0 /100 | #16 | Exceptional $54,866 |
| Immigrants | France | 100.0 /100 | #17 | Exceptional $54,557 |
| Thais | 100.0 /100 | #18 | Exceptional $54,307 |
| Immigrants | China | 100.0 /100 | #19 | Exceptional $54,264 |