Basque vs Nonimmigrants Median Male Earnings
COMPARE
Basque
Nonimmigrants
Median Male Earnings
Median Male Earnings Comparison
Basques
Nonimmigrants
$55,370
MEDIAN MALE EARNINGS
70.3/ 100
METRIC RATING
160th/ 347
METRIC RANK
$52,170
MEDIAN MALE EARNINGS
9.3/ 100
METRIC RATING
214th/ 347
METRIC RANK
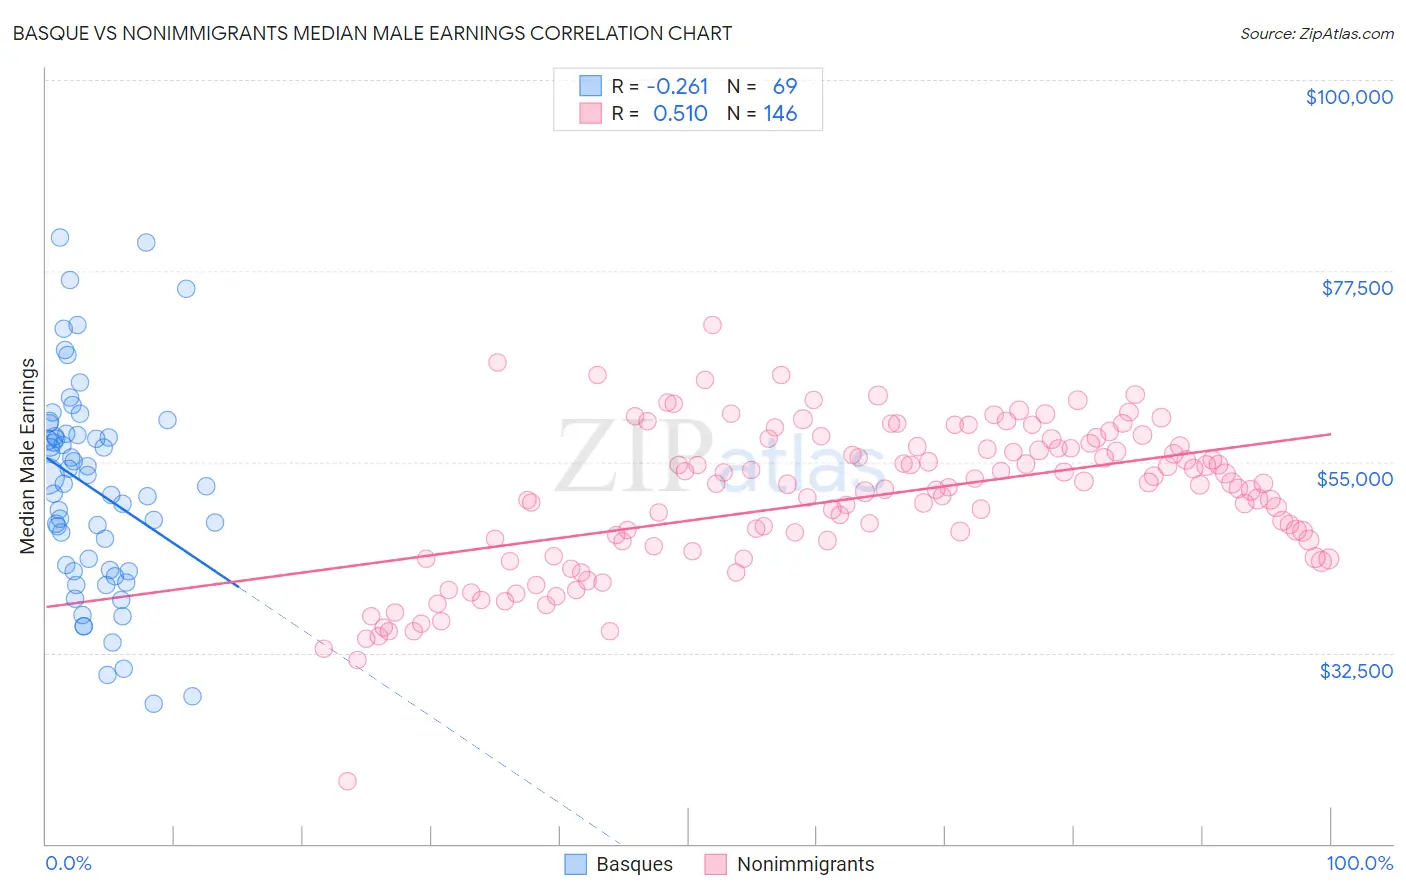
Basque vs Nonimmigrants Median Male Earnings Correlation Chart
The statistical analysis conducted on geographies consisting of 165,750,902 people shows a weak negative correlation between the proportion of Basques and median male earnings in the United States with a correlation coefficient (R) of -0.261 and weighted average of $55,370. Similarly, the statistical analysis conducted on geographies consisting of 582,196,653 people shows a substantial positive correlation between the proportion of Nonimmigrants and median male earnings in the United States with a correlation coefficient (R) of 0.510 and weighted average of $52,170, a difference of 6.1%.
Median Male Earnings Correlation Summary
| Measurement | Basque | Nonimmigrants |
| Minimum | $26,442 | $17,422 |
| Maximum | $81,428 | $71,068 |
| Range | $54,986 | $53,646 |
| Mean | $51,886 | $50,720 |
| Median | $52,492 | $52,345 |
| Interquartile 25% (IQ1) | $42,224 | $45,072 |
| Interquartile 75% (IQ3) | $58,280 | $56,800 |
| Interquartile Range (IQR) | $16,056 | $11,728 |
| Standard Deviation (Sample) | $12,223 | $8,752 |
| Standard Deviation (Population) | $12,134 | $8,722 |
Similar Demographics by Median Male Earnings
Demographics Similar to Basques by Median Male Earnings
In terms of median male earnings, the demographic groups most similar to Basques are Czechoslovakian ($55,382, a difference of 0.020%), Alsatian ($55,380, a difference of 0.020%), Belgian ($55,361, a difference of 0.020%), French ($55,350, a difference of 0.040%), and Icelander ($55,415, a difference of 0.080%).
| Demographics | Rating | Rank | Median Male Earnings |
| Immigrants | Nepal | 75.0 /100 | #153 | Good $55,615 |
| Taiwanese | 73.9 /100 | #154 | Good $55,556 |
| Scandinavians | 73.4 /100 | #155 | Good $55,527 |
| Immigrants | Ethiopia | 71.6 /100 | #156 | Good $55,434 |
| Icelanders | 71.2 /100 | #157 | Good $55,415 |
| Czechoslovakians | 70.5 /100 | #158 | Good $55,382 |
| Alsatians | 70.5 /100 | #159 | Good $55,380 |
| Basques | 70.3 /100 | #160 | Good $55,370 |
| Belgians | 70.1 /100 | #161 | Good $55,361 |
| French | 69.9 /100 | #162 | Good $55,350 |
| Ugandans | 68.6 /100 | #163 | Good $55,290 |
| Immigrants | South Eastern Asia | 67.6 /100 | #164 | Good $55,241 |
| Immigrants | Portugal | 66.3 /100 | #165 | Good $55,182 |
| Germans | 61.6 /100 | #166 | Good $54,974 |
| Immigrants | Fiji | 61.2 /100 | #167 | Good $54,958 |
Demographics Similar to Nonimmigrants by Median Male Earnings
In terms of median male earnings, the demographic groups most similar to Nonimmigrants are Immigrants from Cameroon ($52,119, a difference of 0.10%), Immigrants from Venezuela ($52,041, a difference of 0.25%), Nigerian ($52,039, a difference of 0.25%), Native Hawaiian ($52,306, a difference of 0.26%), and Cajun ($52,325, a difference of 0.30%).
| Demographics | Rating | Rank | Median Male Earnings |
| Vietnamese | 12.7 /100 | #207 | Poor $52,525 |
| Venezuelans | 12.5 /100 | #208 | Poor $52,510 |
| Bermudans | 12.1 /100 | #209 | Poor $52,465 |
| Delaware | 11.5 /100 | #210 | Poor $52,412 |
| Tlingit-Haida | 11.5 /100 | #211 | Poor $52,409 |
| Cajuns | 10.7 /100 | #212 | Poor $52,325 |
| Native Hawaiians | 10.5 /100 | #213 | Poor $52,306 |
| Immigrants | Nonimmigrants | 9.3 /100 | #214 | Tragic $52,170 |
| Immigrants | Cameroon | 8.9 /100 | #215 | Tragic $52,119 |
| Immigrants | Venezuela | 8.3 /100 | #216 | Tragic $52,041 |
| Nigerians | 8.3 /100 | #217 | Tragic $52,039 |
| Immigrants | Panama | 7.7 /100 | #218 | Tragic $51,962 |
| Immigrants | Ghana | 6.9 /100 | #219 | Tragic $51,836 |
| Immigrants | Armenia | 6.6 /100 | #220 | Tragic $51,793 |
| Immigrants | Senegal | 5.8 /100 | #221 | Tragic $51,647 |