Scandinavian vs Nonimmigrants Median Male Earnings
COMPARE
Scandinavian
Nonimmigrants
Median Male Earnings
Median Male Earnings Comparison
Scandinavians
Nonimmigrants
$55,527
MEDIAN MALE EARNINGS
73.4/ 100
METRIC RATING
155th/ 347
METRIC RANK
$52,170
MEDIAN MALE EARNINGS
9.3/ 100
METRIC RATING
214th/ 347
METRIC RANK
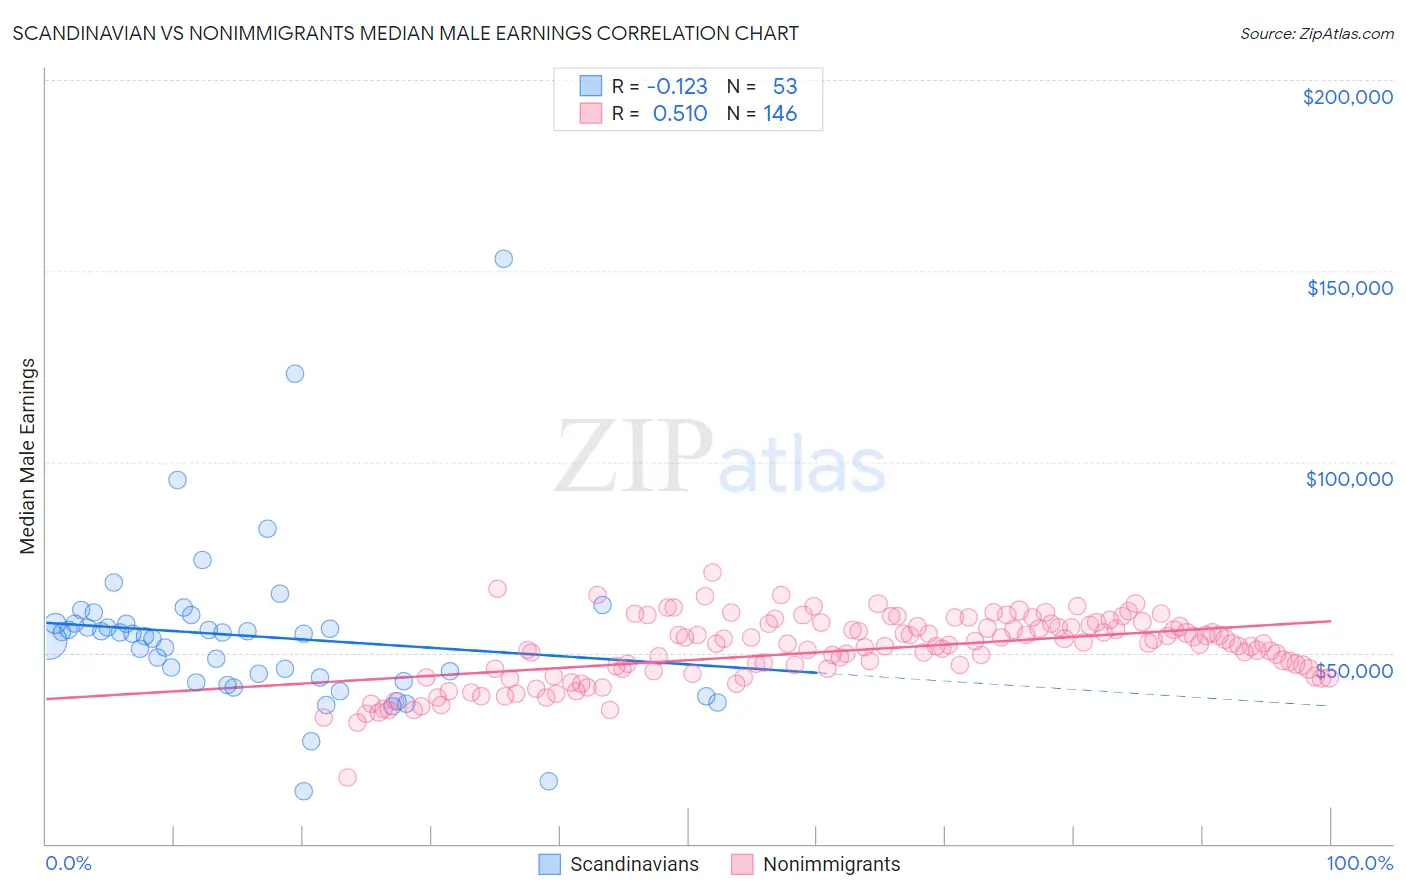
Scandinavian vs Nonimmigrants Median Male Earnings Correlation Chart
The statistical analysis conducted on geographies consisting of 472,245,233 people shows a poor negative correlation between the proportion of Scandinavians and median male earnings in the United States with a correlation coefficient (R) of -0.123 and weighted average of $55,527. Similarly, the statistical analysis conducted on geographies consisting of 582,196,653 people shows a substantial positive correlation between the proportion of Nonimmigrants and median male earnings in the United States with a correlation coefficient (R) of 0.510 and weighted average of $52,170, a difference of 6.4%.
Median Male Earnings Correlation Summary
| Measurement | Scandinavian | Nonimmigrants |
| Minimum | $13,865 | $17,422 |
| Maximum | $153,203 | $71,068 |
| Range | $139,338 | $53,646 |
| Mean | $54,403 | $50,720 |
| Median | $55,045 | $52,345 |
| Interquartile 25% (IQ1) | $42,380 | $45,072 |
| Interquartile 75% (IQ3) | $57,674 | $56,800 |
| Interquartile Range (IQR) | $15,293 | $11,728 |
| Standard Deviation (Sample) | $21,926 | $8,752 |
| Standard Deviation (Population) | $21,718 | $8,722 |
Similar Demographics by Median Male Earnings
Demographics Similar to Scandinavians by Median Male Earnings
In terms of median male earnings, the demographic groups most similar to Scandinavians are Taiwanese ($55,556, a difference of 0.050%), Immigrants from Nepal ($55,615, a difference of 0.16%), Immigrants from Ethiopia ($55,434, a difference of 0.17%), Icelander ($55,415, a difference of 0.20%), and Peruvian ($55,659, a difference of 0.24%).
| Demographics | Rating | Rank | Median Male Earnings |
| Scottish | 78.2 /100 | #148 | Good $55,793 |
| English | 77.4 /100 | #149 | Good $55,747 |
| Swiss | 77.1 /100 | #150 | Good $55,731 |
| Immigrants | Oceania | 76.8 /100 | #151 | Good $55,712 |
| Peruvians | 75.8 /100 | #152 | Good $55,659 |
| Immigrants | Nepal | 75.0 /100 | #153 | Good $55,615 |
| Taiwanese | 73.9 /100 | #154 | Good $55,556 |
| Scandinavians | 73.4 /100 | #155 | Good $55,527 |
| Immigrants | Ethiopia | 71.6 /100 | #156 | Good $55,434 |
| Icelanders | 71.2 /100 | #157 | Good $55,415 |
| Czechoslovakians | 70.5 /100 | #158 | Good $55,382 |
| Alsatians | 70.5 /100 | #159 | Good $55,380 |
| Basques | 70.3 /100 | #160 | Good $55,370 |
| Belgians | 70.1 /100 | #161 | Good $55,361 |
| French | 69.9 /100 | #162 | Good $55,350 |
Demographics Similar to Nonimmigrants by Median Male Earnings
In terms of median male earnings, the demographic groups most similar to Nonimmigrants are Immigrants from Cameroon ($52,119, a difference of 0.10%), Immigrants from Venezuela ($52,041, a difference of 0.25%), Nigerian ($52,039, a difference of 0.25%), Native Hawaiian ($52,306, a difference of 0.26%), and Cajun ($52,325, a difference of 0.30%).
| Demographics | Rating | Rank | Median Male Earnings |
| Vietnamese | 12.7 /100 | #207 | Poor $52,525 |
| Venezuelans | 12.5 /100 | #208 | Poor $52,510 |
| Bermudans | 12.1 /100 | #209 | Poor $52,465 |
| Delaware | 11.5 /100 | #210 | Poor $52,412 |
| Tlingit-Haida | 11.5 /100 | #211 | Poor $52,409 |
| Cajuns | 10.7 /100 | #212 | Poor $52,325 |
| Native Hawaiians | 10.5 /100 | #213 | Poor $52,306 |
| Immigrants | Nonimmigrants | 9.3 /100 | #214 | Tragic $52,170 |
| Immigrants | Cameroon | 8.9 /100 | #215 | Tragic $52,119 |
| Immigrants | Venezuela | 8.3 /100 | #216 | Tragic $52,041 |
| Nigerians | 8.3 /100 | #217 | Tragic $52,039 |
| Immigrants | Panama | 7.7 /100 | #218 | Tragic $51,962 |
| Immigrants | Ghana | 6.9 /100 | #219 | Tragic $51,836 |
| Immigrants | Armenia | 6.6 /100 | #220 | Tragic $51,793 |
| Immigrants | Senegal | 5.8 /100 | #221 | Tragic $51,647 |