Basque vs Immigrants from Uganda Median Male Earnings
COMPARE
Basque
Immigrants from Uganda
Median Male Earnings
Median Male Earnings Comparison
Basques
Immigrants from Uganda
$55,370
MEDIAN MALE EARNINGS
70.3/ 100
METRIC RATING
160th/ 347
METRIC RANK
$56,064
MEDIAN MALE EARNINGS
82.4/ 100
METRIC RATING
144th/ 347
METRIC RANK
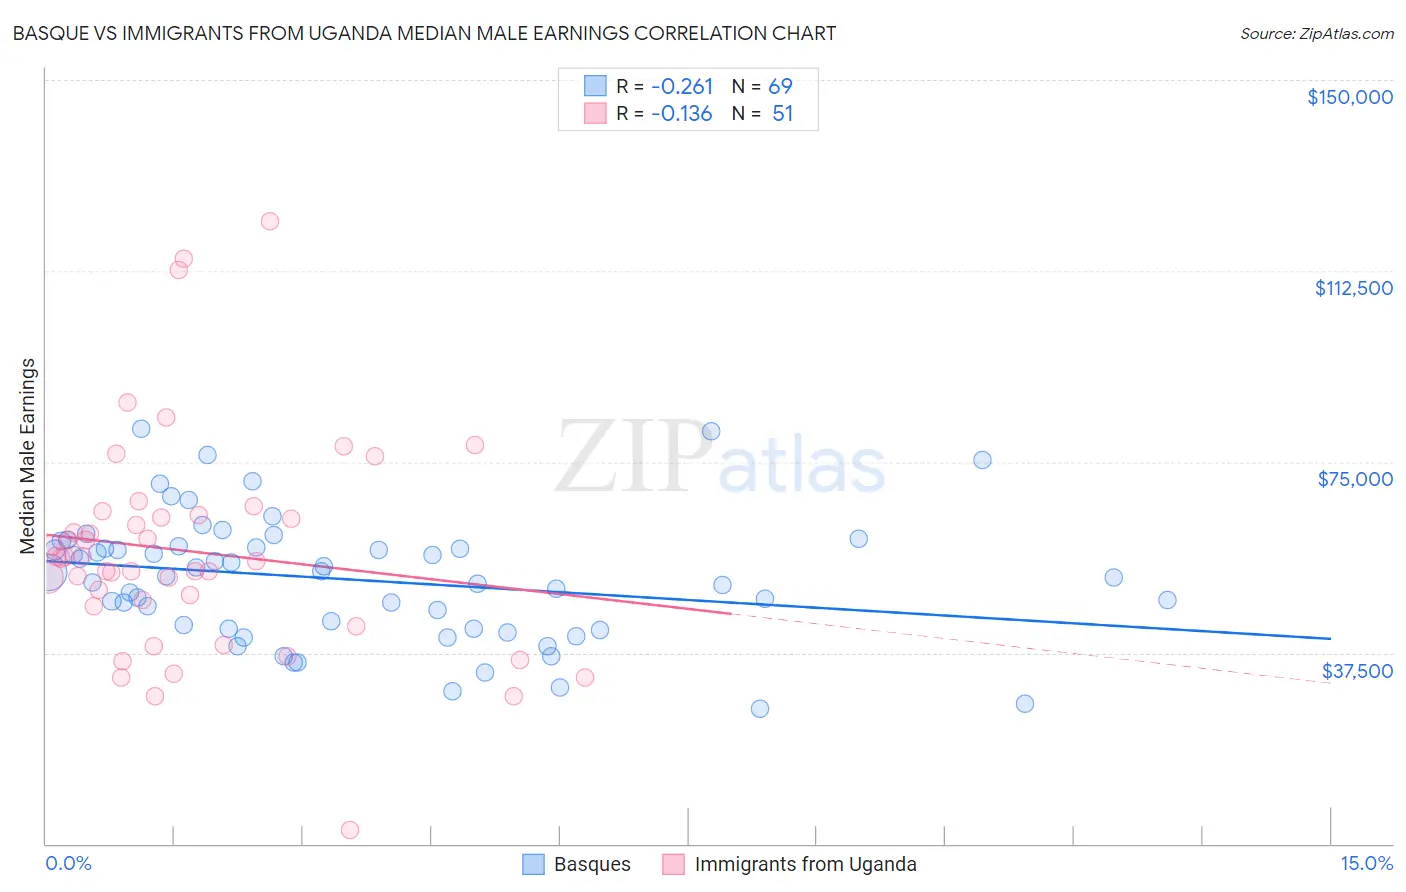
Basque vs Immigrants from Uganda Median Male Earnings Correlation Chart
The statistical analysis conducted on geographies consisting of 165,750,902 people shows a weak negative correlation between the proportion of Basques and median male earnings in the United States with a correlation coefficient (R) of -0.261 and weighted average of $55,370. Similarly, the statistical analysis conducted on geographies consisting of 125,972,834 people shows a poor negative correlation between the proportion of Immigrants from Uganda and median male earnings in the United States with a correlation coefficient (R) of -0.136 and weighted average of $56,064, a difference of 1.3%.
Median Male Earnings Correlation Summary
| Measurement | Basque | Immigrants from Uganda |
| Minimum | $26,442 | $2,614 |
| Maximum | $81,428 | $122,344 |
| Range | $54,986 | $119,730 |
| Mean | $51,886 | $57,441 |
| Median | $52,492 | $56,129 |
| Interquartile 25% (IQ1) | $42,224 | $46,713 |
| Interquartile 75% (IQ3) | $58,280 | $64,485 |
| Interquartile Range (IQR) | $16,056 | $17,772 |
| Standard Deviation (Sample) | $12,223 | $21,598 |
| Standard Deviation (Population) | $12,134 | $21,385 |
Demographics Similar to Basques and Immigrants from Uganda by Median Male Earnings
In terms of median male earnings, the demographic groups most similar to Basques are Czechoslovakian ($55,382, a difference of 0.020%), Alsatian ($55,380, a difference of 0.020%), Belgian ($55,361, a difference of 0.020%), French ($55,350, a difference of 0.040%), and Icelander ($55,415, a difference of 0.080%). Similarly, the demographic groups most similar to Immigrants from Uganda are Sri Lankan ($56,136, a difference of 0.13%), Norwegian ($55,965, a difference of 0.18%), Immigrants from Chile ($55,954, a difference of 0.20%), Ethiopian ($56,243, a difference of 0.32%), and Immigrants from Philippines ($55,809, a difference of 0.46%).
| Demographics | Rating | Rank | Median Male Earnings |
| Ethiopians | 84.8 /100 | #142 | Excellent $56,243 |
| Sri Lankans | 83.4 /100 | #143 | Excellent $56,136 |
| Immigrants | Uganda | 82.4 /100 | #144 | Excellent $56,064 |
| Norwegians | 80.9 /100 | #145 | Excellent $55,965 |
| Immigrants | Chile | 80.7 /100 | #146 | Excellent $55,954 |
| Immigrants | Philippines | 78.4 /100 | #147 | Good $55,809 |
| Scottish | 78.2 /100 | #148 | Good $55,793 |
| English | 77.4 /100 | #149 | Good $55,747 |
| Swiss | 77.1 /100 | #150 | Good $55,731 |
| Immigrants | Oceania | 76.8 /100 | #151 | Good $55,712 |
| Peruvians | 75.8 /100 | #152 | Good $55,659 |
| Immigrants | Nepal | 75.0 /100 | #153 | Good $55,615 |
| Taiwanese | 73.9 /100 | #154 | Good $55,556 |
| Scandinavians | 73.4 /100 | #155 | Good $55,527 |
| Immigrants | Ethiopia | 71.6 /100 | #156 | Good $55,434 |
| Icelanders | 71.2 /100 | #157 | Good $55,415 |
| Czechoslovakians | 70.5 /100 | #158 | Good $55,382 |
| Alsatians | 70.5 /100 | #159 | Good $55,380 |
| Basques | 70.3 /100 | #160 | Good $55,370 |
| Belgians | 70.1 /100 | #161 | Good $55,361 |
| French | 69.9 /100 | #162 | Good $55,350 |