Basque vs Polish Median Male Earnings
COMPARE
Basque
Polish
Median Male Earnings
Median Male Earnings Comparison
Basques
Poles
$55,370
MEDIAN MALE EARNINGS
70.3/ 100
METRIC RATING
160th/ 347
METRIC RANK
$58,139
MEDIAN MALE EARNINGS
97.3/ 100
METRIC RATING
103rd/ 347
METRIC RANK
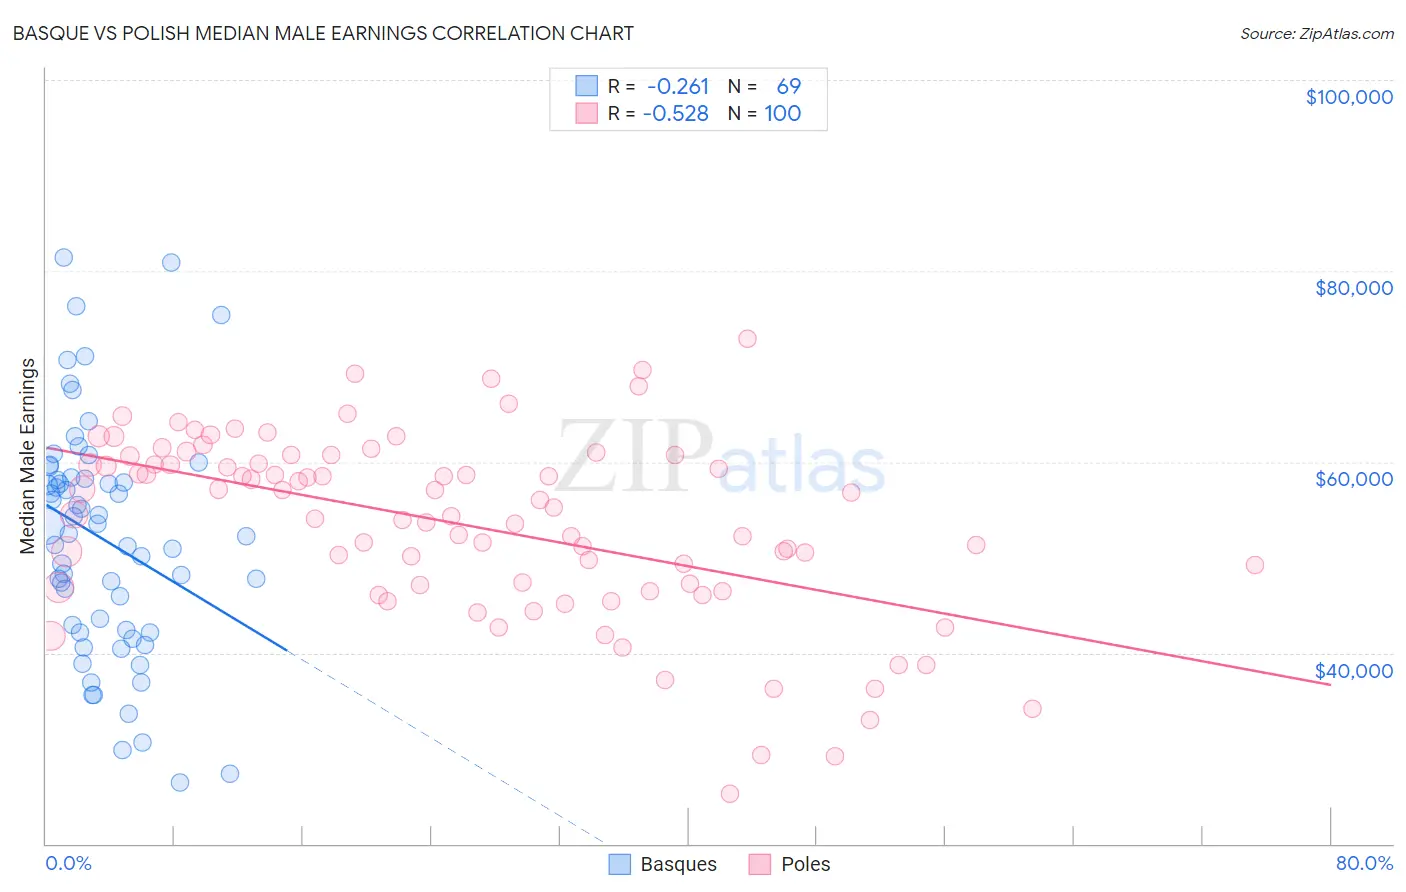
Basque vs Polish Median Male Earnings Correlation Chart
The statistical analysis conducted on geographies consisting of 165,750,902 people shows a weak negative correlation between the proportion of Basques and median male earnings in the United States with a correlation coefficient (R) of -0.261 and weighted average of $55,370. Similarly, the statistical analysis conducted on geographies consisting of 559,585,611 people shows a substantial negative correlation between the proportion of Poles and median male earnings in the United States with a correlation coefficient (R) of -0.528 and weighted average of $58,139, a difference of 5.0%.
Median Male Earnings Correlation Summary
| Measurement | Basque | Polish |
| Minimum | $26,442 | $25,204 |
| Maximum | $81,428 | $72,933 |
| Range | $54,986 | $47,729 |
| Mean | $51,886 | $53,382 |
| Median | $52,492 | $54,879 |
| Interquartile 25% (IQ1) | $42,224 | $46,953 |
| Interquartile 75% (IQ3) | $58,280 | $60,187 |
| Interquartile Range (IQR) | $16,056 | $13,234 |
| Standard Deviation (Sample) | $12,223 | $9,652 |
| Standard Deviation (Population) | $12,134 | $9,604 |
Similar Demographics by Median Male Earnings
Demographics Similar to Basques by Median Male Earnings
In terms of median male earnings, the demographic groups most similar to Basques are Czechoslovakian ($55,382, a difference of 0.020%), Alsatian ($55,380, a difference of 0.020%), Belgian ($55,361, a difference of 0.020%), French ($55,350, a difference of 0.040%), and Icelander ($55,415, a difference of 0.080%).
| Demographics | Rating | Rank | Median Male Earnings |
| Immigrants | Nepal | 75.0 /100 | #153 | Good $55,615 |
| Taiwanese | 73.9 /100 | #154 | Good $55,556 |
| Scandinavians | 73.4 /100 | #155 | Good $55,527 |
| Immigrants | Ethiopia | 71.6 /100 | #156 | Good $55,434 |
| Icelanders | 71.2 /100 | #157 | Good $55,415 |
| Czechoslovakians | 70.5 /100 | #158 | Good $55,382 |
| Alsatians | 70.5 /100 | #159 | Good $55,380 |
| Basques | 70.3 /100 | #160 | Good $55,370 |
| Belgians | 70.1 /100 | #161 | Good $55,361 |
| French | 69.9 /100 | #162 | Good $55,350 |
| Ugandans | 68.6 /100 | #163 | Good $55,290 |
| Immigrants | South Eastern Asia | 67.6 /100 | #164 | Good $55,241 |
| Immigrants | Portugal | 66.3 /100 | #165 | Good $55,182 |
| Germans | 61.6 /100 | #166 | Good $54,974 |
| Immigrants | Fiji | 61.2 /100 | #167 | Good $54,958 |
Demographics Similar to Poles by Median Male Earnings
In terms of median male earnings, the demographic groups most similar to Poles are Armenian ($58,134, a difference of 0.010%), Immigrants from Western Asia ($58,131, a difference of 0.020%), Syrian ($58,187, a difference of 0.080%), Immigrants from Northern Africa ($58,008, a difference of 0.23%), and Serbian ($57,975, a difference of 0.28%).
| Demographics | Rating | Rank | Median Male Earnings |
| Albanians | 98.4 /100 | #96 | Exceptional $58,680 |
| Northern Europeans | 98.2 /100 | #97 | Exceptional $58,588 |
| Jordanians | 98.1 /100 | #98 | Exceptional $58,500 |
| Immigrants | Poland | 98.0 /100 | #99 | Exceptional $58,452 |
| Assyrians/Chaldeans/Syriacs | 97.9 /100 | #100 | Exceptional $58,437 |
| Immigrants | Brazil | 97.7 /100 | #101 | Exceptional $58,324 |
| Syrians | 97.4 /100 | #102 | Exceptional $58,187 |
| Poles | 97.3 /100 | #103 | Exceptional $58,139 |
| Armenians | 97.3 /100 | #104 | Exceptional $58,134 |
| Immigrants | Western Asia | 97.3 /100 | #105 | Exceptional $58,131 |
| Immigrants | Northern Africa | 96.9 /100 | #106 | Exceptional $58,008 |
| Serbians | 96.8 /100 | #107 | Exceptional $57,975 |
| Immigrants | Uzbekistan | 96.7 /100 | #108 | Exceptional $57,941 |
| British | 96.5 /100 | #109 | Exceptional $57,890 |
| Palestinians | 96.2 /100 | #110 | Exceptional $57,778 |