Swedish vs Nonimmigrants Median Male Earnings
COMPARE
Swedish
Nonimmigrants
Median Male Earnings
Median Male Earnings Comparison
Swedes
Nonimmigrants
$57,445
MEDIAN MALE EARNINGS
94.8/ 100
METRIC RATING
115th/ 347
METRIC RANK
$52,170
MEDIAN MALE EARNINGS
9.3/ 100
METRIC RATING
214th/ 347
METRIC RANK
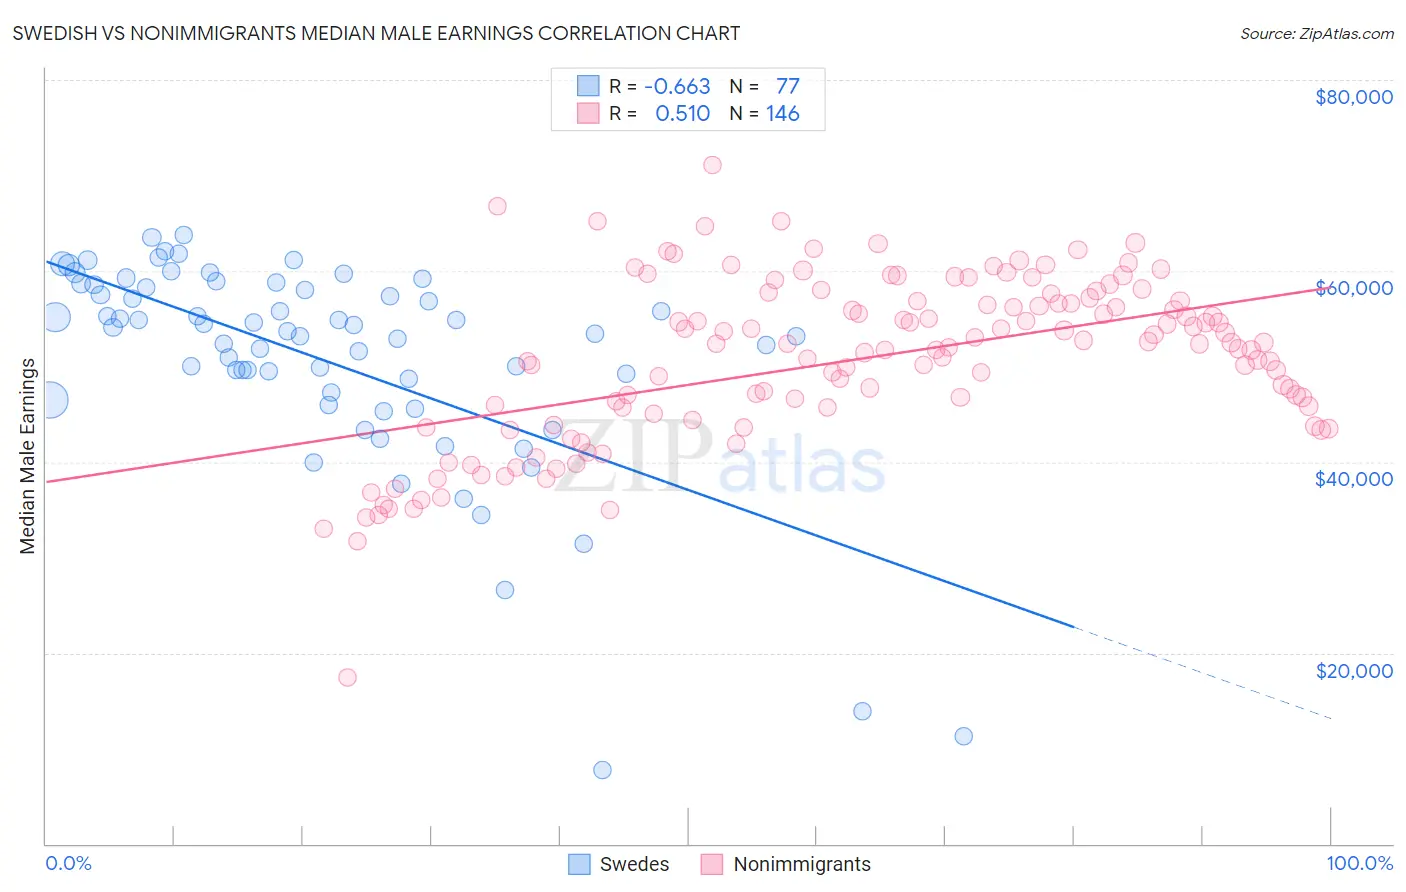
Swedish vs Nonimmigrants Median Male Earnings Correlation Chart
The statistical analysis conducted on geographies consisting of 538,411,583 people shows a significant negative correlation between the proportion of Swedes and median male earnings in the United States with a correlation coefficient (R) of -0.663 and weighted average of $57,445. Similarly, the statistical analysis conducted on geographies consisting of 582,196,653 people shows a substantial positive correlation between the proportion of Nonimmigrants and median male earnings in the United States with a correlation coefficient (R) of 0.510 and weighted average of $52,170, a difference of 10.1%.
Median Male Earnings Correlation Summary
| Measurement | Swedish | Nonimmigrants |
| Minimum | $7,750 | $17,422 |
| Maximum | $63,730 | $71,068 |
| Range | $55,980 | $53,646 |
| Mean | $50,664 | $50,720 |
| Median | $53,721 | $52,345 |
| Interquartile 25% (IQ1) | $46,926 | $45,072 |
| Interquartile 75% (IQ3) | $58,399 | $56,800 |
| Interquartile Range (IQR) | $11,473 | $11,728 |
| Standard Deviation (Sample) | $11,170 | $8,752 |
| Standard Deviation (Population) | $11,097 | $8,722 |
Similar Demographics by Median Male Earnings
Demographics Similar to Swedes by Median Male Earnings
In terms of median male earnings, the demographic groups most similar to Swedes are Lebanese ($57,409, a difference of 0.060%), Immigrants from Zimbabwe ($57,352, a difference of 0.16%), Immigrants from Kuwait ($57,562, a difference of 0.20%), Carpatho Rusyn ($57,572, a difference of 0.22%), and Immigrants from Afghanistan ($57,582, a difference of 0.24%).
| Demographics | Rating | Rank | Median Male Earnings |
| Immigrants | Uzbekistan | 96.7 /100 | #108 | Exceptional $57,941 |
| British | 96.5 /100 | #109 | Exceptional $57,890 |
| Palestinians | 96.2 /100 | #110 | Exceptional $57,778 |
| Europeans | 95.6 /100 | #111 | Exceptional $57,637 |
| Immigrants | Afghanistan | 95.4 /100 | #112 | Exceptional $57,582 |
| Carpatho Rusyns | 95.3 /100 | #113 | Exceptional $57,572 |
| Immigrants | Kuwait | 95.3 /100 | #114 | Exceptional $57,562 |
| Swedes | 94.8 /100 | #115 | Exceptional $57,445 |
| Lebanese | 94.6 /100 | #116 | Exceptional $57,409 |
| Immigrants | Zimbabwe | 94.3 /100 | #117 | Exceptional $57,352 |
| Hungarians | 94.0 /100 | #118 | Exceptional $57,309 |
| Arabs | 94.0 /100 | #119 | Exceptional $57,298 |
| Canadians | 93.9 /100 | #120 | Exceptional $57,286 |
| Immigrants | Albania | 93.3 /100 | #121 | Exceptional $57,179 |
| Immigrants | Jordan | 93.1 /100 | #122 | Exceptional $57,145 |
Demographics Similar to Nonimmigrants by Median Male Earnings
In terms of median male earnings, the demographic groups most similar to Nonimmigrants are Immigrants from Cameroon ($52,119, a difference of 0.10%), Immigrants from Venezuela ($52,041, a difference of 0.25%), Nigerian ($52,039, a difference of 0.25%), Native Hawaiian ($52,306, a difference of 0.26%), and Cajun ($52,325, a difference of 0.30%).
| Demographics | Rating | Rank | Median Male Earnings |
| Vietnamese | 12.7 /100 | #207 | Poor $52,525 |
| Venezuelans | 12.5 /100 | #208 | Poor $52,510 |
| Bermudans | 12.1 /100 | #209 | Poor $52,465 |
| Delaware | 11.5 /100 | #210 | Poor $52,412 |
| Tlingit-Haida | 11.5 /100 | #211 | Poor $52,409 |
| Cajuns | 10.7 /100 | #212 | Poor $52,325 |
| Native Hawaiians | 10.5 /100 | #213 | Poor $52,306 |
| Immigrants | Nonimmigrants | 9.3 /100 | #214 | Tragic $52,170 |
| Immigrants | Cameroon | 8.9 /100 | #215 | Tragic $52,119 |
| Immigrants | Venezuela | 8.3 /100 | #216 | Tragic $52,041 |
| Nigerians | 8.3 /100 | #217 | Tragic $52,039 |
| Immigrants | Panama | 7.7 /100 | #218 | Tragic $51,962 |
| Immigrants | Ghana | 6.9 /100 | #219 | Tragic $51,836 |
| Immigrants | Armenia | 6.6 /100 | #220 | Tragic $51,793 |
| Immigrants | Senegal | 5.8 /100 | #221 | Tragic $51,647 |