Arab vs Welsh Per Capita Income
COMPARE
Arab
Welsh
Per Capita Income
Per Capita Income Comparison
Arabs
Welsh
$45,662
PER CAPITA INCOME
90.4/ 100
METRIC RATING
130th/ 347
METRIC RANK
$43,233
PER CAPITA INCOME
38.2/ 100
METRIC RATING
181st/ 347
METRIC RANK
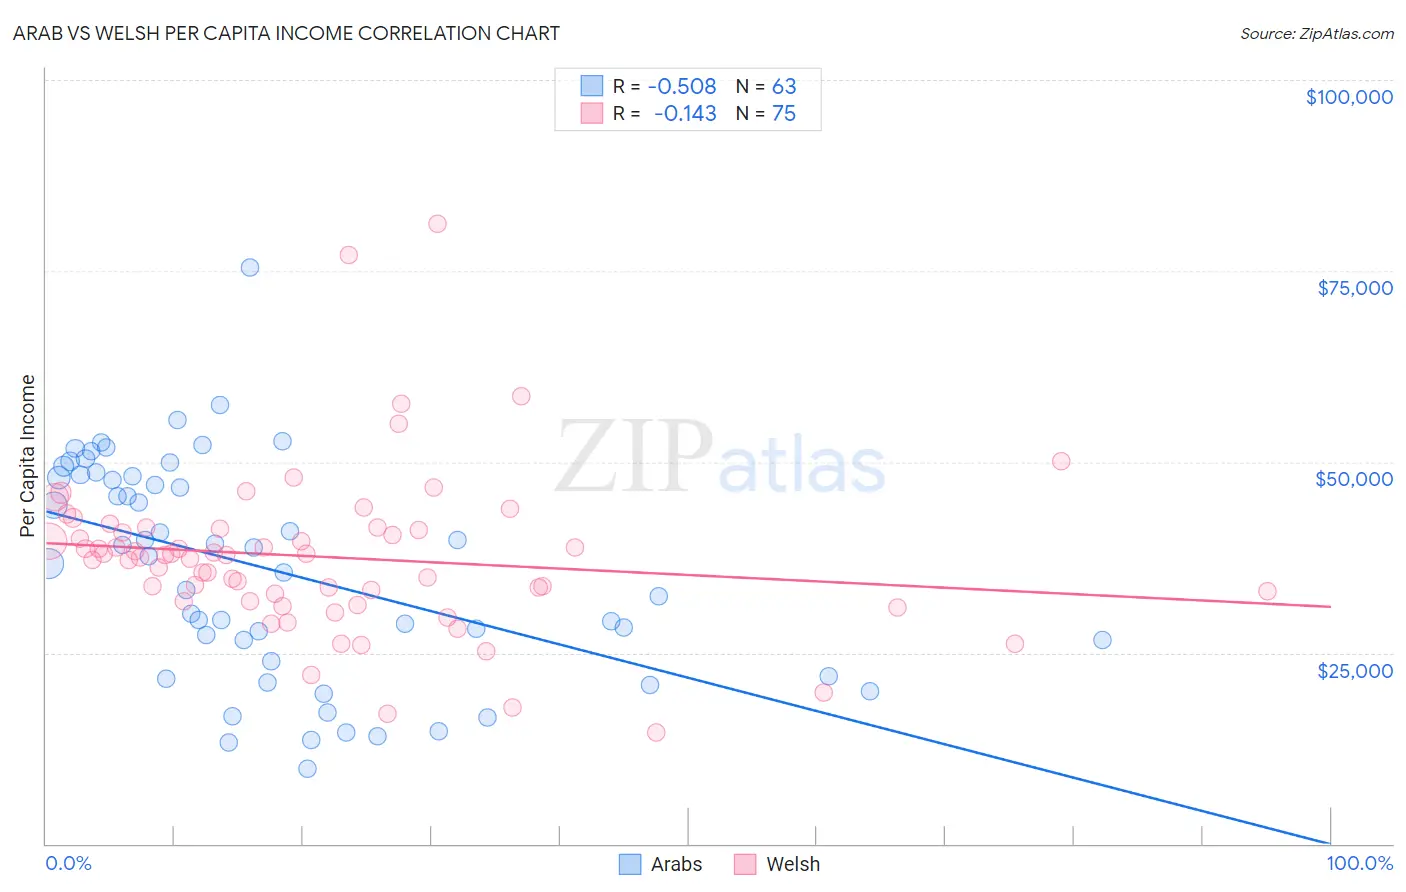
Arab vs Welsh Per Capita Income Correlation Chart
The statistical analysis conducted on geographies consisting of 486,915,485 people shows a substantial negative correlation between the proportion of Arabs and per capita income in the United States with a correlation coefficient (R) of -0.508 and weighted average of $45,662. Similarly, the statistical analysis conducted on geographies consisting of 528,640,565 people shows a poor negative correlation between the proportion of Welsh and per capita income in the United States with a correlation coefficient (R) of -0.143 and weighted average of $43,233, a difference of 5.6%.
Per Capita Income Correlation Summary
| Measurement | Arab | Welsh |
| Minimum | $9,805 | $14,496 |
| Maximum | $75,372 | $81,151 |
| Range | $65,567 | $66,655 |
| Mean | $35,873 | $37,545 |
| Median | $37,723 | $37,753 |
| Interquartile 25% (IQ1) | $23,895 | $31,788 |
| Interquartile 75% (IQ3) | $48,040 | $41,266 |
| Interquartile Range (IQR) | $24,145 | $9,478 |
| Standard Deviation (Sample) | $14,217 | $10,767 |
| Standard Deviation (Population) | $14,103 | $10,695 |
Similar Demographics by Per Capita Income
Demographics Similar to Arabs by Per Capita Income
In terms of per capita income, the demographic groups most similar to Arabs are Luxembourger ($45,663, a difference of 0.0%), Immigrants from North Macedonia ($45,622, a difference of 0.090%), Jordanian ($45,605, a difference of 0.12%), Pakistani ($45,587, a difference of 0.16%), and Slovene ($45,581, a difference of 0.18%).
| Demographics | Rating | Rank | Per Capita Income |
| Lebanese | 92.0 /100 | #123 | Exceptional $45,840 |
| Europeans | 92.0 /100 | #124 | Exceptional $45,836 |
| Zimbabweans | 91.7 /100 | #125 | Exceptional $45,804 |
| Palestinians | 91.6 /100 | #126 | Exceptional $45,790 |
| Immigrants | Germany | 91.3 /100 | #127 | Exceptional $45,751 |
| Swedes | 91.3 /100 | #128 | Exceptional $45,750 |
| Luxembourgers | 90.4 /100 | #129 | Exceptional $45,663 |
| Arabs | 90.4 /100 | #130 | Exceptional $45,662 |
| Immigrants | North Macedonia | 90.0 /100 | #131 | Exceptional $45,622 |
| Jordanians | 89.9 /100 | #132 | Excellent $45,605 |
| Pakistanis | 89.7 /100 | #133 | Excellent $45,587 |
| Slovenes | 89.6 /100 | #134 | Excellent $45,581 |
| Hungarians | 87.9 /100 | #135 | Excellent $45,426 |
| Immigrants | Oceania | 85.2 /100 | #136 | Excellent $45,220 |
| Immigrants | Syria | 85.2 /100 | #137 | Excellent $45,218 |
Demographics Similar to Welsh by Per Capita Income
In terms of per capita income, the demographic groups most similar to Welsh are Immigrants from Vietnam ($43,229, a difference of 0.010%), German ($43,067, a difference of 0.38%), Sierra Leonean ($43,405, a difference of 0.40%), Spaniard ($43,028, a difference of 0.48%), and Immigrants ($43,010, a difference of 0.52%).
| Demographics | Rating | Rank | Per Capita Income |
| Colombians | 50.0 /100 | #174 | Average $43,661 |
| Celtics | 48.9 /100 | #175 | Average $43,621 |
| Immigrants | South Eastern Asia | 46.6 /100 | #176 | Average $43,539 |
| Tlingit-Haida | 45.9 /100 | #177 | Average $43,516 |
| Immigrants | Costa Rica | 44.5 /100 | #178 | Average $43,464 |
| Finns | 44.4 /100 | #179 | Average $43,461 |
| Sierra Leoneans | 42.9 /100 | #180 | Average $43,405 |
| Welsh | 38.2 /100 | #181 | Fair $43,233 |
| Immigrants | Vietnam | 38.1 /100 | #182 | Fair $43,229 |
| Germans | 33.9 /100 | #183 | Fair $43,067 |
| Spaniards | 32.9 /100 | #184 | Fair $43,028 |
| Immigrants | Immigrants | 32.5 /100 | #185 | Fair $43,010 |
| French Canadians | 32.3 /100 | #186 | Fair $43,003 |
| Immigrants | Colombia | 31.5 /100 | #187 | Fair $42,971 |
| Immigrants | Africa | 31.0 /100 | #188 | Fair $42,950 |