Arab vs Lithuanian Per Capita Income
COMPARE
Arab
Lithuanian
Per Capita Income
Per Capita Income Comparison
Arabs
Lithuanians
$45,662
PER CAPITA INCOME
90.4/ 100
METRIC RATING
130th/ 347
METRIC RANK
$49,448
PER CAPITA INCOME
99.8/ 100
METRIC RATING
68th/ 347
METRIC RANK
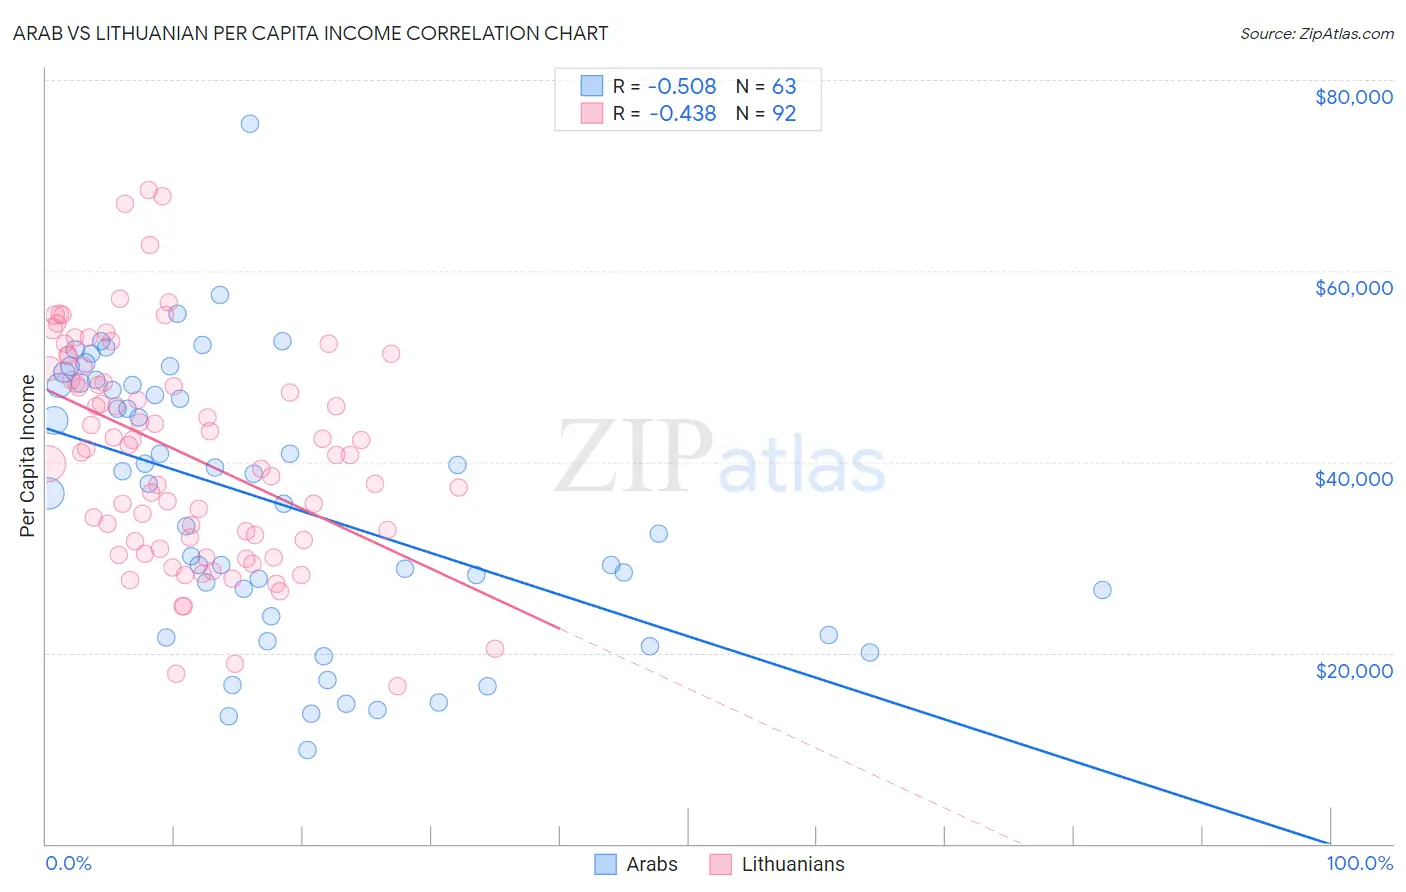
Arab vs Lithuanian Per Capita Income Correlation Chart
The statistical analysis conducted on geographies consisting of 486,915,485 people shows a substantial negative correlation between the proportion of Arabs and per capita income in the United States with a correlation coefficient (R) of -0.508 and weighted average of $45,662. Similarly, the statistical analysis conducted on geographies consisting of 421,963,914 people shows a moderate negative correlation between the proportion of Lithuanians and per capita income in the United States with a correlation coefficient (R) of -0.438 and weighted average of $49,448, a difference of 8.3%.
Per Capita Income Correlation Summary
| Measurement | Arab | Lithuanian |
| Minimum | $9,805 | $16,487 |
| Maximum | $75,372 | $68,542 |
| Range | $65,567 | $52,055 |
| Mean | $35,873 | $40,931 |
| Median | $37,723 | $41,220 |
| Interquartile 25% (IQ1) | $23,895 | $31,717 |
| Interquartile 75% (IQ3) | $48,040 | $49,156 |
| Interquartile Range (IQR) | $24,145 | $17,439 |
| Standard Deviation (Sample) | $14,217 | $11,469 |
| Standard Deviation (Population) | $14,103 | $11,406 |
Similar Demographics by Per Capita Income
Demographics Similar to Arabs by Per Capita Income
In terms of per capita income, the demographic groups most similar to Arabs are Luxembourger ($45,663, a difference of 0.0%), Immigrants from North Macedonia ($45,622, a difference of 0.090%), Jordanian ($45,605, a difference of 0.12%), Pakistani ($45,587, a difference of 0.16%), and Slovene ($45,581, a difference of 0.18%).
| Demographics | Rating | Rank | Per Capita Income |
| Lebanese | 92.0 /100 | #123 | Exceptional $45,840 |
| Europeans | 92.0 /100 | #124 | Exceptional $45,836 |
| Zimbabweans | 91.7 /100 | #125 | Exceptional $45,804 |
| Palestinians | 91.6 /100 | #126 | Exceptional $45,790 |
| Immigrants | Germany | 91.3 /100 | #127 | Exceptional $45,751 |
| Swedes | 91.3 /100 | #128 | Exceptional $45,750 |
| Luxembourgers | 90.4 /100 | #129 | Exceptional $45,663 |
| Arabs | 90.4 /100 | #130 | Exceptional $45,662 |
| Immigrants | North Macedonia | 90.0 /100 | #131 | Exceptional $45,622 |
| Jordanians | 89.9 /100 | #132 | Excellent $45,605 |
| Pakistanis | 89.7 /100 | #133 | Excellent $45,587 |
| Slovenes | 89.6 /100 | #134 | Excellent $45,581 |
| Hungarians | 87.9 /100 | #135 | Excellent $45,426 |
| Immigrants | Oceania | 85.2 /100 | #136 | Excellent $45,220 |
| Immigrants | Syria | 85.2 /100 | #137 | Excellent $45,218 |
Demographics Similar to Lithuanians by Per Capita Income
In terms of per capita income, the demographic groups most similar to Lithuanians are Immigrants from Romania ($49,463, a difference of 0.030%), Immigrants from Bulgaria ($49,482, a difference of 0.070%), Immigrants from Canada ($49,412, a difference of 0.070%), Bolivian ($49,526, a difference of 0.16%), and Immigrants from Eastern Europe ($49,316, a difference of 0.27%).
| Demographics | Rating | Rank | Per Capita Income |
| Argentineans | 99.9 /100 | #61 | Exceptional $49,862 |
| Immigrants | Asia | 99.9 /100 | #62 | Exceptional $49,741 |
| Maltese | 99.9 /100 | #63 | Exceptional $49,640 |
| Immigrants | Argentina | 99.9 /100 | #64 | Exceptional $49,627 |
| Bolivians | 99.9 /100 | #65 | Exceptional $49,526 |
| Immigrants | Bulgaria | 99.9 /100 | #66 | Exceptional $49,482 |
| Immigrants | Romania | 99.9 /100 | #67 | Exceptional $49,463 |
| Lithuanians | 99.8 /100 | #68 | Exceptional $49,448 |
| Immigrants | Canada | 99.8 /100 | #69 | Exceptional $49,412 |
| Immigrants | Eastern Europe | 99.8 /100 | #70 | Exceptional $49,316 |
| Greeks | 99.8 /100 | #71 | Exceptional $49,309 |
| Immigrants | Hungary | 99.8 /100 | #72 | Exceptional $49,303 |
| Immigrants | North America | 99.8 /100 | #73 | Exceptional $49,302 |
| Mongolians | 99.8 /100 | #74 | Exceptional $49,173 |
| Immigrants | Bolivia | 99.7 /100 | #75 | Exceptional $48,970 |